

A business credit line calculator should measure more than the interest on money drawn. In the United States, 34% of employer firms regularly used lines of credit in 2023, while 53% regularly used business loans, so the question isn't whether revolving credit is common, but whether the facility fits your draw pattern and cash flow.
You may be looking at a line that appears inexpensive because the advertised APR sits below the term-loan alternatives on your desk. That headline rate can hide unused-line charges, draw fees, maintenance costs, minimum interest rules, and repayment requirements that change the economics completely.
For an established operator, especially one managing complex inventory cycles, payroll, receivables, or expansion costs, affordability isn't the same as approval readiness. A lender will look at utilization, payment history, existing obligations, and cash-flow coverage. The right calculator connects all of those variables before you submit an application.
Table of Contents
- Why a Realistic Calculator Matters Before You Apply
- Inputs a Business Credit Line Calculator Must Capture
- Core Formulas for Interest, Fees, and True Cost
- Sample Scenarios With Different Draw Patterns
- Stress-Testing the Output Against Lender Thresholds
- Common Mistakes That Skew the Numbers
- Pre-Application Checklist and Next Steps
Why a Realistic Calculator Matters Before You Apply
Maya owns a wholesale-distribution company generating $11 million in revenue. Her lender offered a $250,000 revolving line at 9%, which looked attractive until she read the fee schedule. The facility also carried a 1.5% annual unused fee and a $25 charge per draw.
Her expected average borrowing was $80,000, but her difficult operating year could require $190,000. The concern wasn't the interest rate. Maya wanted to know whether the facility would charge her for capacity she rarely used, then become expensive precisely when seasonal working-capital pressure forced her to draw more.
That concern is justified. A rigorous calculator must separate the approved limit from the amount borrowed. Interest applies to the drawn balance, while unused-line fees apply to the available capacity under the lender's agreement. Draw frequency, maintenance charges, and repayment behavior then determine the all-in cost.
Practical rule: Never evaluate a line from the rate alone. Model the balance you'll carry, the capacity you'll leave unused, and the number of times you'll access the facility.
The calculation should also identify a breakeven utilization level. Below that point, a term loan may be cheaper because its pricing is attached to a funded balance rather than idle capacity. Above it, a line may justify its flexibility, particularly when you can repay quickly after each draw.
Dun & Bradstreet's PAYDEX score provides one example of the payment-history infrastructure lenders use. It's a dollar-weighted index based on the last two years of trade-payment history, designed to summarize how reliably a business pays vendors. A calculator can't replace underwriting, but it should reflect the same broad signals, including payment history, utilization, and creditworthiness, that shape lender decisions. Dun & Bradstreet's explanation of PAYDEX and business credit reports provides useful context.
Inputs a Business Credit Line Calculator Must Capture
Treat every calculator field as a business decision, not lender paperwork. The credit limit defines the maximum exposure, while the average drawn balance drives the interest estimate. Your peak draw balance matters because it reveals whether the facility will be large enough during the pressure month, not merely comfortable during an average month.
You'll also need annual gross revenue, gross margin, fixed monthly operating expenses, current annual debt service, and the minimum DSCR you're willing to accept. Revenue and margin indicate how much operating cash the company can produce. Expenses and existing debt service show how much of that cash is already committed. The desired DSCR floor turns the result into an approval test rather than a payment estimate.
| Input | Output It Changes | Common Blind Spot |
|---|---|---|
| Credit limit | Available capacity and unused-line cost | Choosing the limit from a headline offer instead of the cash cycle |
| Average drawn balance | Annual interest and effective rate | Using the intended draw instead of actual average usage |
| Peak draw balance | Capacity sufficiency and covenant pressure | Ignoring seasonal inventory or payroll spikes |
| Revenue and gross margin | Operating cash-flow estimate | Annualizing an unusually strong period |
| Fixed expenses | Cash available for debt service | Excluding recurring overhead that fluctuates |
| Existing annual debt service | DSCR and approval capacity | Leaving out equipment financing or MCA debits |
| Desired DSCR floor | Stress-test pass or fail | Setting a target below lender expectations |
| Fees and repayment assumptions | True cost and cash requirement | Assuming interest-only repayment when principal paydown is required |
The secondary fields often decide the answer. Add variable APR, annualized unused fees, per-draw charges, annual maintenance, minimum interest or rate floors, and the repayment method. Interest-only draws and principal-amortizing draws create very different cash demands even when the approved limit is identical.
Owners regularly under-report seasonal peak usage, merchant cash advance buyouts folded into debt service, and personal guarantees that return as financial covenants. A calculator that accepts only the limit and rate will produce a tidy number that may fail under committee review.
For broader balance-sheet preparation, the Escrow Consulting Group CEO guide offers useful perspective on how owners can organize financial information for decision-making. Before modeling a facility, review how a line of credit works for a business so your assumptions match the product's actual mechanics.
Core Formulas for Interest, Fees, and True Cost
The central mistake in many calculators is simple: they treat the APR as the total borrowing cost. It isn't. The calculator should apply the rate to the average balance, then add every fee tied to access, availability, or maintenance.
Use these formulas:
- Drawn interest = average drawn balance × APR
- Unused-line fee = (credit limit − average drawn balance) × unused fee rate
- Draw fees = number of draws × fee per draw
- Annual maintenance = flat annual charge
- Total all-in cost = drawn interest + unused-line fee + draw fees + maintenance
- Effective rate = total all-in cost ÷ average drawn balance
The methodology is consistent with the principle that interest is charged on funds borrowed, while unused fees apply to undrawn capacity. This business line of credit calculator methodology also emphasizes adding draw, maintenance, and unused-line charges instead of stopping at interest.
Worked example
Assume the following facility:
- Credit limit: $250,000
- Average balance: $80,000
- APR: 9%
- Unused-line fee: 1.5%
- Draws: six per year
- Per-draw fee: $25
- Annual maintenance fee: $250
| Line Item | Formula | Amount |
|---|---|---|
| Drawn interest | $80,000 × 9% | $7,200 |
| Unused-line fee | ($250,000 − $80,000) × 1.5% | $2,550 |
| Draw fees | 6 × $25 | $150 |
| Annual maintenance | Flat fee | $250 |
| Total cost | $7,200 + $2,550 + $150 + $250 | $10,150 |
The effective rate is 12.69%, calculated as $10,150 ÷ $80,000, not the advertised 9%. The difference comes from paying for unused capacity and repeated access.
The utilization calculation also matters. An $80,000 average balance on a $250,000 limit equals 32% utilization, which leaves most of the facility undrawn. At low utilization, fixed and unused fees are spread over a smaller amount of working capital.
The breakeven calculation should solve for the average balance where the line's all-in rate matches the comparison loan. In this simplified example, the unused fee falls as the balance rises, while interest rises with the balance. That interaction is why utilization below roughly 35% often makes a line more expensive than its offer-sheet rate suggests. The exact breakeven still depends on draw fees, maintenance, repayment speed, and the term loan's own APR and charges. For a clean comparison, review APR versus interest rate before entering the competing loan's cost.
Sample Scenarios With Different Draw Patterns
Average utilization can conceal the operating reality. Two companies can use the same $250,000 line and produce very different costs because one repays rapidly while the other carries a balance for most of the year.
Profile A draws $90,000 for 60 days, pays it off, and repeats that pattern monthly. The line supports inventory purchases or receivable timing without remaining permanently funded. Its average utilization stays near 30%, but the business incurs repeated draw fees and must maintain enough headroom for the next cycle.
Profile B holds $180,000 outstanding for nine months with no meaningful paydown. That represents 72% utilization of the facility. The company gets more funding value from the limit, but it also carries interest for longer and has less room when an unexpected need appears.
The comparison below uses the stated draw patterns and the fee methodology above. A proper model should calculate the exact balance by period, not rely on a single annual average.
| Metric | Profile A, Frequent Paydown | Profile B, Sustained Draw | 24-Month Term Loan |
|---|---|---|---|
| Primary use | Repeating short working-capital cycles | Long-duration operating funding | Fixed funded amount |
| Balance behavior | Draw, repay, and redraw | High balance for most of the year | Scheduled amortization |
| Main cost pressure | Draw fees and unused capacity | Extended interest and reduced flexibility | Interest and principal cadence |
| Utilization profile | Near 30% average | 72% during the sustained draw | Not measured as revolving utilization |
| Relative result in the stated comparison | About $4,000 cheaper annually than the term loan | About $7,000 more expensive than the term loan | Benchmark structure |
| Approximate equivalence window | 35% to 45% facility utilization | 35% to 45% facility utilization | Comparison depends on terms |
The conclusion is decisive. Profile A can justify a line because the business repeatedly converts borrowed cash back into available capacity. Profile B is using revolving credit as permanent debt, which undermines the product's main advantage. A term loan may provide a cleaner structure for that sustained need.
For this $250,000 facility, the approximate 35% to 45% utilization window is where the line and a 24-month term loan can perform similarly under the stated comparison. Don't treat that range as universal. Recalculate it whenever the APR, unused fee, draw frequency, or repayment schedule changes.
Stress-Testing the Output Against Lender Thresholds
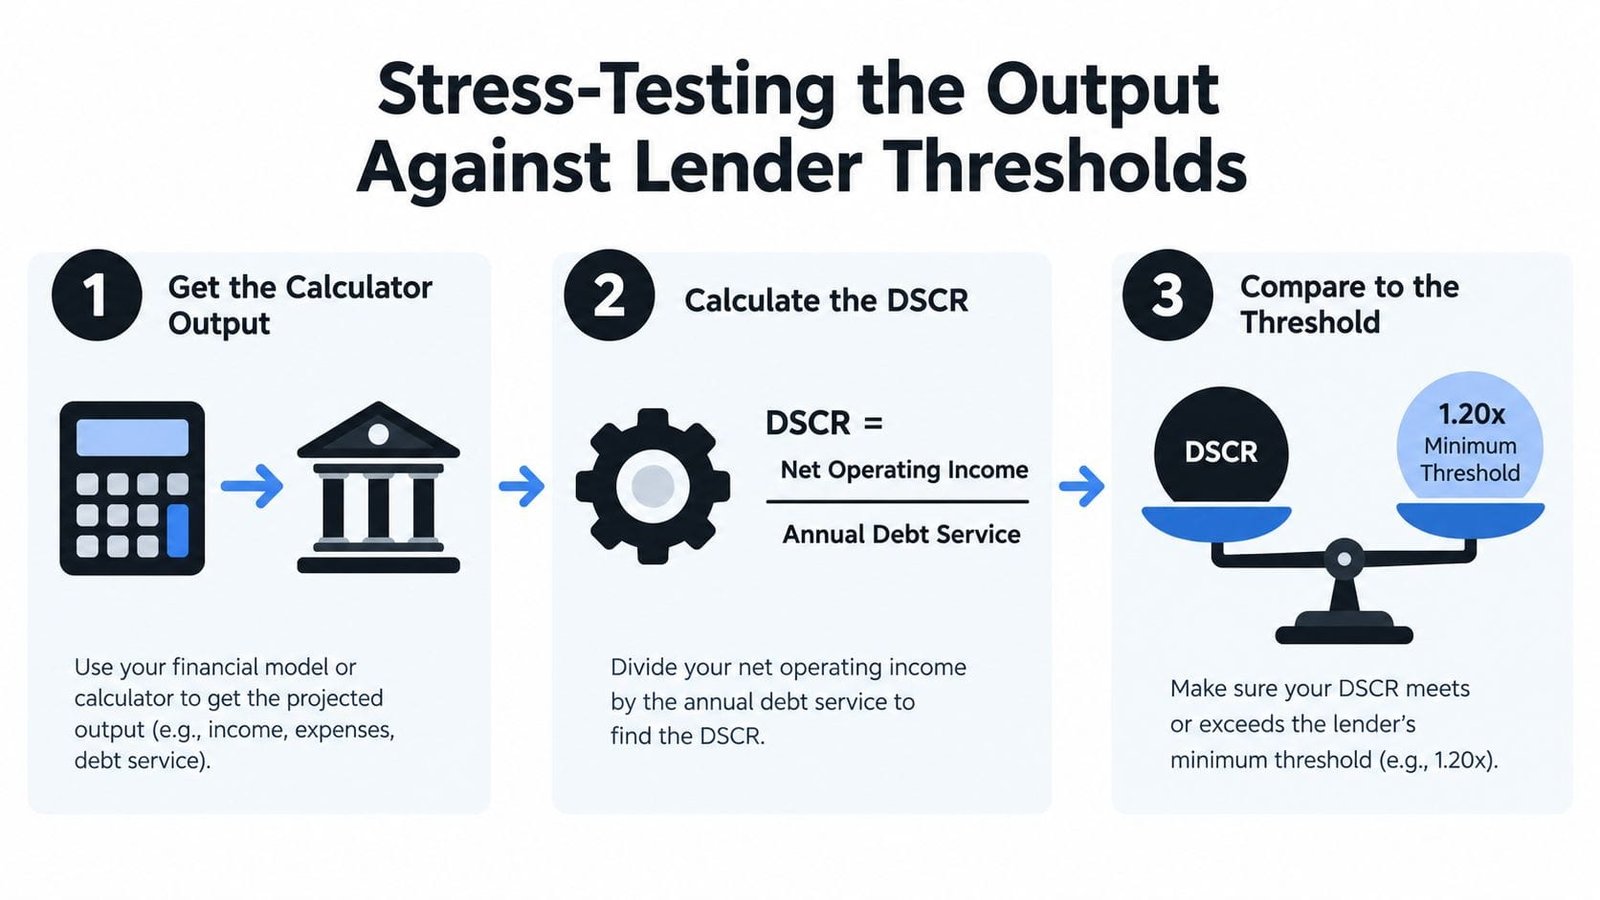
A payment can look affordable while the business still fails underwriting. Lenders commonly translate cash flow into debt service coverage ratio, or DSCR, using this formula:
DSCR = annual net operating cash flow ÷ annual debt service
Annual debt service must include principal and interest on term loans, projected interest from the modeled line utilization, equipment financing, lease payments, SBA debt, and merchant cash advance debits. The lender is testing whether operating cash flow covers the full obligation stack, not whether the new line payment fits in isolation.
Commercial lenders commonly use a minimum DSCR near 1.20x, while SBA-backed borrowing often targets 1.25x or higher, according to the business line of credit DSCR calculator guidance. Those thresholds mean annual operating cash flow should exceed annual debt service by roughly 20% to 25% before approval odds improve.
Build the lender version of the model
Start with trailing cash flow, not the best recent month. Then run at least two adverse cases:
- Revenue pressure: Reduce revenue by 5% while keeping fixed expenses and debt service in place.
- Rate pressure: Increase the line rate by 100 basis points, then recalculate projected interest and DSCR.
The calculator should show the utilization level at which additional line interest pushes DSCR below the target floor. That number tells you when the facility stops being a helpful buffer and starts creating approval or covenant risk.
Underwriters also assess the quality and consistency of cash flow, not just the ratio. Bank stress-testing frameworks provide useful background on how institutions examine resilience across adverse conditions, as described in this overview of financial institution risk modeling. Your model doesn't need to replicate a bank's system, but it should challenge the assumptions you'll present.
Common Mistakes That Skew the Numbers
A polished calculator can still deliver a bad answer if the inputs flatter the business. These are the errors I see most often.
Annualizing one excellent month. A strong sales month may reflect a temporary contract, a seasonal shipment, or delayed invoices. Use trailing-12-month cash flow and isolate non-recurring revenue before calculating repayment capacity.
Ignoring repeated draw fees. Small draws feel inexpensive because each charge looks minor. Count every planned draw, especially when the company regularly funds payroll, inventory, or receivable gaps.
Averaging away peak utilization. A low annual average can hide a month when the line is nearly full. Enter the peak balance separately and test whether the remaining availability covers the actual operating shock.

Treating availability fees as generic overhead. An unused-line fee is a cost of reserved capacity. Divide it against the dollars you draw, not the limit printed on the approval letter. That produces a more honest effective rate when utilization is light.
Comparing a line rate with a term-loan APR without normalizing timing. A revolving line may charge interest only while drawn, while a term loan funds the full amount and amortizes through scheduled payments. Compare total annual cost, average balance, fees, and cash-flow timing. These short-term business financing mistakes are a useful reminder that product structure can matter as much as the headline price.
The correction is practical: preserve the month-by-month draw schedule, record every fee, and compare the resulting cash requirement with the company's actual debt-service capacity.
Pre-Application Checklist and Next Steps
Run this checklist before sending financial information to a lender. It's designed to catch the gaps that make a calculator optimistic and an application fragile.
- Verify DSCR: Confirm the ratio clears 1.20x after rolling in every existing debt obligation and the modeled line cost.
- Check utilization: Confirm the twelve-month average stays between 30% and 70%, then review the peak month separately.
- Review interest savings: Compare monthly savings against existing debt with the line's unused fee and access charges included.
- Gather bank statements: Prepare six months of bank statements that show deposits, withdrawals, and recurring debt payments.
- Prepare AR and AP aging: Separate collectible receivables from balances that may not convert to cash soon.
- Remove revenue distortions: Isolate non-recurring spikes, unusual customer payments, and one-time transactions.
- Confirm tax-return timing: Make sure entity tax returns are within 24 months and reconcile reported revenue with bank activity.
- Identify the guarantor: Confirm a primary guarantor has personal liquidity coverage of at least 25% of the requested limit.
- Document draw behavior: Save the month-by-month schedule showing when you'll draw, how much you'll use, and how quickly you'll repay.

Your application should carry the same assumptions as the calculator. If the lender sees a different revenue period, debt schedule, or utilization pattern, the indicative offer may change. Keep the model updated and rerun the stress test quarterly, plus any time your revenue mix, payroll, or existing debt service changes.
This video provides another practical visual reference for preparing a financing application:
Business Loan Warrior helps owners compare lines of credit, SBA financing, term loans, equipment funding, and other working-capital options through a single no-fee application. Visit Business Loan Warrior to model your financing needs, check pre-approval without affecting credit, and move from a realistic draw schedule to a funding option suited to you.