
A bakery owner adds 10% to last year's sales and uses the result to plan staffing, ingredients, and a new delivery van. Then a wholesale contract disappears, and revenue finishes a third below plan.
The problem isn't that the owner made a forecast. It's that one growth rate stood in for the customers, orders, prices, and payment dates that actually drive sales and cash. Learning how to forecast revenue means replacing a single confident number with a model that shows what could happen, why, and when a shortfall might require borrowing.
Table of Contents
- Choose a Forecasting Method That Fits Your Revenue Model
- How to Build Your Revenue Forecast Step by Step
- Spreadsheet Layout for a Revenue Forecast Model
- Running Scenarios and Sensitivity Tests
- KPIs That Show Whether Your Forecast Is Accurate
- Build a 13-Week Cash Forecast From Your Revenue Model
- Prepare a Lender-Ready Forecast Before You Apply
Choose a Forecasting Method That Fits Your Revenue Model
A forecast is a measurable prediction, not a promise. A cross-country study of selected OECD governments found that macroeconomic uncertainty, including errors in GDP forecasts, affects revenue-forecast errors, and that forecast accuracy varies with factors such as timing and institutional independence (a study of government revenue forecasting). For a business, that means tying projected revenue to operating drivers, then checking whether external conditions could change those drivers. Customers, conversion rates, average transaction value, utilization, pricing, churn, and payment timing are more useful starting points than a flat annual growth percentage.
| Method | Best fit | Core input | Effort |
|---|---|---|---|
| Bottom-up | Service firms, e-commerce, B2B with countable orders | Customers × average order value × purchase frequency | High |
| Top-down | New products, new markets, no sales history | Market size and a stated share percentage | Low |
| Cohort | Subscriptions, memberships, repeat purchases | Monthly revenue per customer start month | Medium |
| Seasonal | Retail, tourism, landscaping, seasonal contractors | Monthly index per period applied to a base level | Low to medium |
Bottom-up models start with units the business can count: booked jobs, orders, active customers, or billable hours. Top-down models start with an addressable market and an explicit share assumption. A market research questionnaire can help check whether the assumptions behind a new offer are plausible; this market research questionnaire guide can help structure that inquiry.
Cohort forecasting groups customers by when they joined, then tracks how their spending or retention changes. A seasonal model applies monthly indices to a base level. For a restaurant, a practical companion is the AnchOps guide to restaurant sales forecasting, which offers context for thinking about sales patterns specific to restaurant operations.
Use these decision rules:
- Countable units: Start bottom-up when you can forecast orders, customers, jobs, or hours.
- Clear peak periods: Add a seasonal layer when peak months run 20% or more above the monthly average.
- Recurring customers: Use cohorts for subscriptions and repeat purchasing so retention and customer spending aren't mistaken for new-customer growth.
- Limited history: With under 12 months of sales, start with top-down sizing and document the source for each market-share assumption. As invoice data builds over the next two quarters, convert those assumptions into a bottom-up model and compare it with actual results.
Most small firms combine methods, usually a driver model with a seasonal index. Set up base, upside, and downside cases from the beginning. Those scenarios make clear which assumptions change the outlook, instead of presenting one sales total as certain.
How to Build Your Revenue Forecast Step by Step
Use a repeatable workflow. A spreadsheet is enough to begin, provided each assumption has a source and the forecast keeps revenue streams separate until the final total.
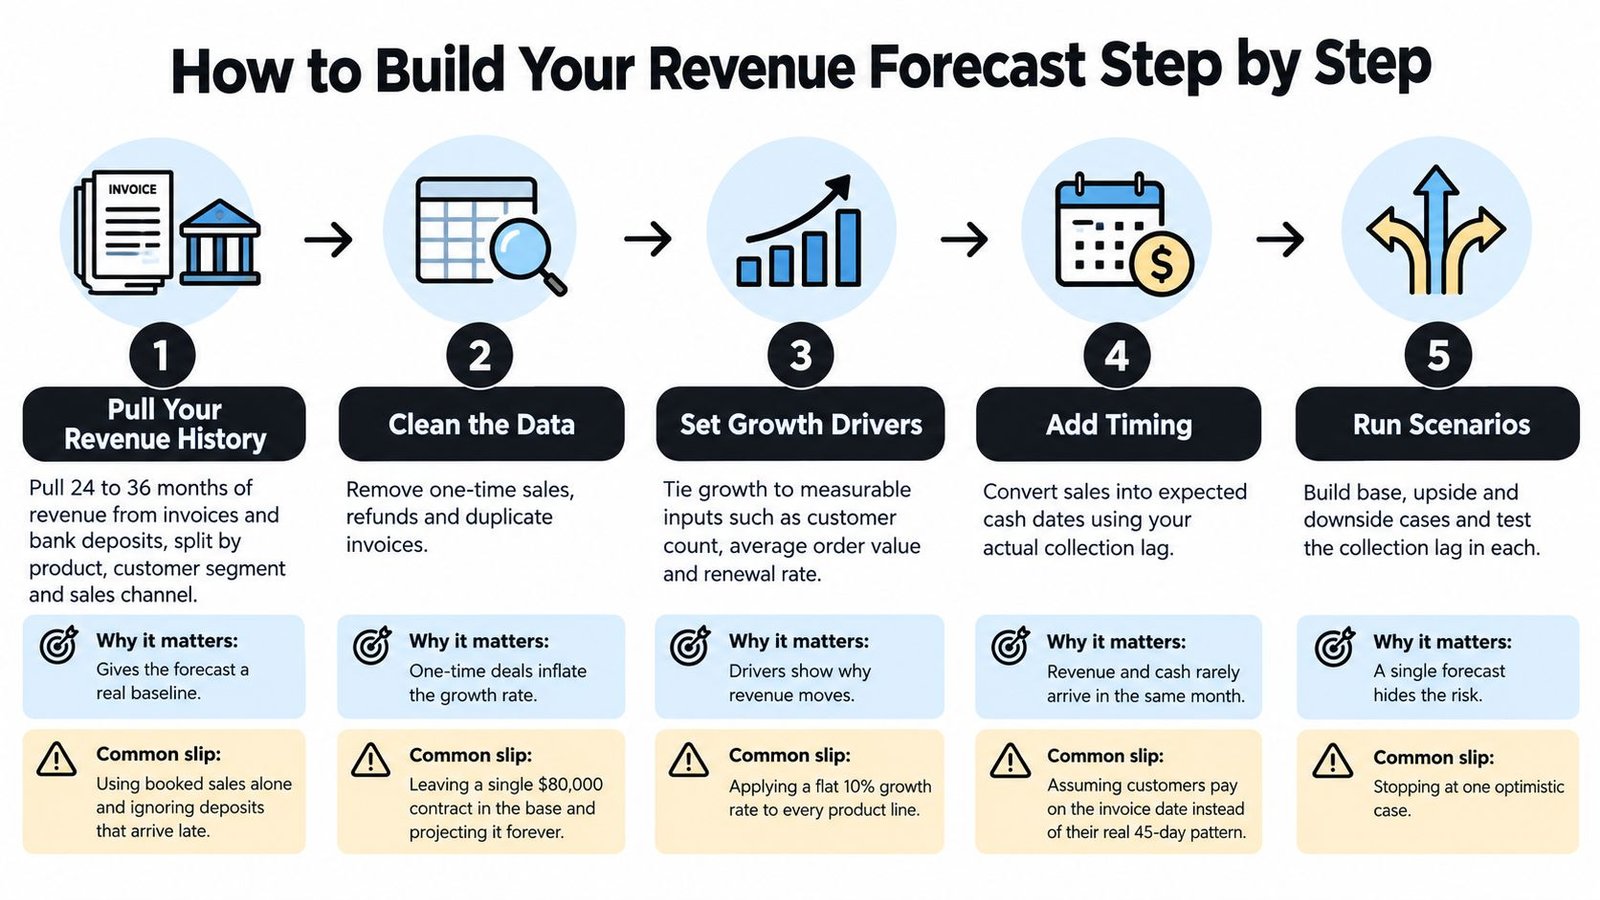
- Pull the history. Bring in 24 to 36 months of revenue from invoices and bank deposits, split by product, customer segment, and sales channel. The reason is straightforward: invoices show what you billed, while deposits show what reached the bank. A common slip is to forecast from invoice totals alone and miss late collections.
- Reconcile and tag unusual items. Match deposits to invoices where possible, and label one-off events such as a large project, refund, or lost client. Otherwise, an exceptional contract can distort the trend and get projected into future months as if it were recurring.
- Choose measurable drivers. Use three to five drivers per revenue stream. For an online shop, that might be customers × average order value × purchase frequency. For a service firm, use billable hours × utilization × hourly rate. Don't choose drivers you can't update reliably each month.
- Document each assumption. Record whether a value comes from the trailing twelve-month trend, a signed contract, or the historical close rate for qualified proposals. A growth percentage with no supporting source isn't an assumption you can test.
- Calculate revenue by stream. Project each stream monthly, then apply its own seasonality index. Seasonalizing total revenue can hide the fact that one product peaks in summer while another stays steady.
- Test against prior results. Run the model against a period you didn't use to build it. The holdout test and a practical accuracy benchmark are covered in the KPI section. Don't keep adjusting the model until it matches every past month; that can make it look more accurate than it is.
- Add confidence ranges. Give each stream a base, upside, and downside assumption, and keep the inputs in one place. A forecast to the exact dollar suggests a level of certainty the underlying customer, pricing, and timing assumptions usually can't support.
Incomplete records don't rule out a useful forecast. Combine bank transactions, invoices, backlog, and customer concentration, then flag changes in prices, capacity, locations, or customer behavior for owner review. Software can help categorize transactions and produce draft scenarios, but it can't reliably decide on its own whether an unusual deposit is recurring revenue or whether a business change has broken the old pattern.
A 2022 study comparing forecasting methods for local-government revenue found that ARIMA performed best among the tested approaches on its one-year test period under two error measures. The study also found that simpler traditional methods generally outperformed the machine-learning approaches it tested, and described average annual error below 5% as a reasonable benchmark for a good forecast (the 2022 revenue-forecasting study). That's a reason to establish a simple baseline first, not to assume a particular model will work best for your company.
Spreadsheet Layout for a Revenue Forecast Model
A usable workbook doesn't need to be elaborate. It needs to be traceable, easy to update, and hard to break.
Set three rules before building tabs:
- Centralize assumptions: Keep every assumption on one Inputs tab with its source and date.
- Separate inputs from formulas: Use a consistent fill color for hard-coded values and a different style for calculated cells. Don't bury typed numbers inside formulas.
- Version the file: Put the version date in the header so everyone knows which forecast they're reviewing.
| Tab | What it holds | Key formula or rule |
|---|---|---|
| Inputs | Every assumption with source and date | Hard-coded values only, one cell per assumption |
| Drivers | Customers, order value, and frequency per stream per month | Customers × average order value × frequency |
| Seasonality | Twelve monthly indices based on historical results | Month actual ÷ average monthly actual |
| Revenue Forecast | Monthly revenue by stream and total | Driver output × seasonality index |
| Scenarios | Base, downside, and upside values for each lever | INDEX or CHOOSE driven by one case-selector cell |
| Actuals vs Forecast | Monthly actuals, variance, and percent error | Absolute error ÷ actual |
The seasonality indices should average 1.00 across the year. Calculate each month's index by dividing that month's actual revenue by the average monthly actual. In the forecast, multiply each stream's monthly driver output by its corresponding index. Keep the index formula visible, so a bookkeeper or manager can check whether a peak month reflects the records rather than a guess.
For example, a service firm with 120 active clients, a $450 average invoice, and 1.5 invoices per client per month forecasts $81,000 in monthly revenue before seasonality. In spreadsheet terms, the Drivers tab calculates 120 × $450 × 1.5; the Revenue Forecast tab then multiplies that result by the relevant monthly index. The Scenarios tab can hold different client counts, average invoices, or purchase frequencies, while one case-selector cell chooses which values flow into the forecast.
Add a check cell that confirms the sum of stream revenue matches company total revenue. Lock formula cells before sharing the workbook with a bookkeeper; leave only intended input cells editable. These small controls help catch overwritten formulas and totals that don't reconcile before the forecast informs a hiring or borrowing decision.
Running Scenarios and Sensitivity Tests
A landscaping company budgets around 45-day customer collections. Then spring invoices take 60 days to turn into cash, just as crews need payroll and materials. The sales forecast can still be close, but the timing shift may force the company to draw on its credit line.
A scenario moves several connected assumptions together to describe a plausible future. A sensitivity test changes one assumption at a time to reveal which input has the greatest effect. Use scenarios to plan for different conditions, and sensitivity tests to see whether the forecast depends too heavily on one lever.

| Lever | Downside | Base | Upside |
|---|---|---|---|
| Monthly customer volume | Down 15% | Trailing 12-month trend | Up 10% |
| Average order value | Down 5% | Current price list | Up 5% with price increase held |
| Purchase frequency per year | 1.8 | 2.2 | 2.5 |
| Days to collect | 60 | 45 | 30 |
| Monthly churn on recurring accounts | 6% | 3% | 2% |
Those values are scenario inputs, not predictions that every business should use. Replace them with assumptions grounded in your own orders, invoices, pricing, and renewal patterns. If the business sells more units at the same average price, a 10% change in volume will generally move annual revenue by about 10%, assuming other drivers hold steady. A change in collection days affects when cash arrives, not the revenue recorded from a sale.
Keep the risks separate: A sales shortfall changes the revenue outlook. A collection delay changes the cash calendar. Your forecast should show both.
Name the conditions that would make each scenario happen. For instance, a downside volume case might be tied to a delayed opening or a lost distribution partner. Don't combine every downside assumption automatically if those risks aren't connected; a price cut, customer loss, and longer collection lag might not all occur together.
Review the case selector before each board or lender meeting, and confirm that its linked assumptions still reflect current conditions. For a quick explanation of scenario planning and financial modeling, use the video below as a prompt for reviewing your own assumptions.
KPIs That Show Whether Your Forecast Is Accurate
A forecast can look convincing when it's compared with the same data used to build it. A holdout test checks whether it predicts months the model hasn't seen: build the forecast using data up to twelve months ago, project the following twelve months, then compare each prediction with the actual result. This shows whether the model carries useful information into the future, not just whether it can reproduce the past.
| Metric | Formula | Healthy reading |
|---|---|---|
| Mean absolute percentage error | Average of |actual − forecast| ÷ actual | Under 5% for the year |
| Bias | Sum of (forecast − actual) ÷ sum of actual | Near zero; a persistent sign means a systematic miss |
| Forecast dispersion | (Upside − downside) ÷ base | Widens only when new information arrives |
| Pipeline conversion | Closed deals ÷ proposals sent | Within 5 points of the assumed rate |
| Collection lag | Average days from invoice to cash | Matches the days-to-collect input |
The 2022 revenue-forecasting study cited average annual error below 5% as a reasonable benchmark for a good forecast, while also finding that relatively simple approaches could outperform more complex machine-learning models (the forecasting study). Treat that benchmark as a reference point, not a guarantee. Businesses differ in data quality and volatility, so your own holdout results matter more than the appeal of an elaborate model. For an e-commerce operator choosing which sales measures to monitor alongside forecasting, Arlo Inc.’s guide to ecommerce KPIs that drive profit offers a useful way to connect operating measures with profitability.
Review forecast misses monthly and assign each one to its likely cause:
- Volume: Did you win fewer customers or orders than expected?
- Price: Did discounts, price changes, or product mix change the average sale?
- Timing: Did the sale or collection move to another month?
- Churn: Did recurring customers leave or spend less often?
- One-off events: Did an exceptional project, refund, or lost account distort the month?
Fix the assumption that caused the miss, rather than applying a general adjustment across all streams. Don't adopt machine learning just because it's available; use it only if it beats a seasonal baseline on your own holdout data.
Build a 13-Week Cash Forecast From Your Revenue Model
Revenue becomes a borrowing decision only after you put it on a cash calendar. Start with base-case monthly revenue by stream, then apply each customer's expected collection timing. For example, a 45-day collection lag means October invoices may arrive around mid-December, not in October's cash balance.
Build a rolling forecast with one row for each of the next 13 weeks. If you want a starting point for laying out weekly inflows and outflows, this guide to using a cash flow forecast template can help organize the schedule.
- Set opening cash. Enter the bank balance on the first Monday in the first row. Use the actual available balance, not a month-end estimate.
- Schedule collections. Place expected receipts in the week they're likely to arrive, using customer payment patterns and invoice dates from Actuals vs Forecast.
- Enter fixed payments on their dates. Put payroll, rent, and other regular costs in the week the bank account will pay them. Don't average a payroll run across several weeks.
- Place growth-related outflows. Schedule loan repayments and inventory purchases when they're due, including purchases that happen before the sales they support.
- Flag the minimum-cash breach. Set a minimum-cash threshold, such as one month of fixed costs. Calculate weekly closing cash after receipts and payments, then flag the first week below the threshold.
Repeat the schedule using the downside case, with collections shifted by 15, 30, or 60 days. The comparison shows whether a temporary line of credit could bridge a timing gap or whether the business needs to change spending plans. For a deeper guide to connecting cash forecasting with borrowing choices, see how to build a cash flow forecast that empowers your loan strategy.
The common mistake is spreading payroll across weeks as if the money leaves gradually. Enter it when it's actually paid, or the forecast may hide the week the funding gap opens.
Prepare a Lender-Ready Forecast Before You Apply
Revenue and available cash aren't interchangeable. A recent U.S. small-business survey found that 39% of firms had less than one month of operating cash on hand, while 58.4% met or exceeded their revenue projections (the small-business growth survey). That gap is why a lender needs to see when customers pay, when the company pays its bills, and whether cash remains above a minimum threshold.
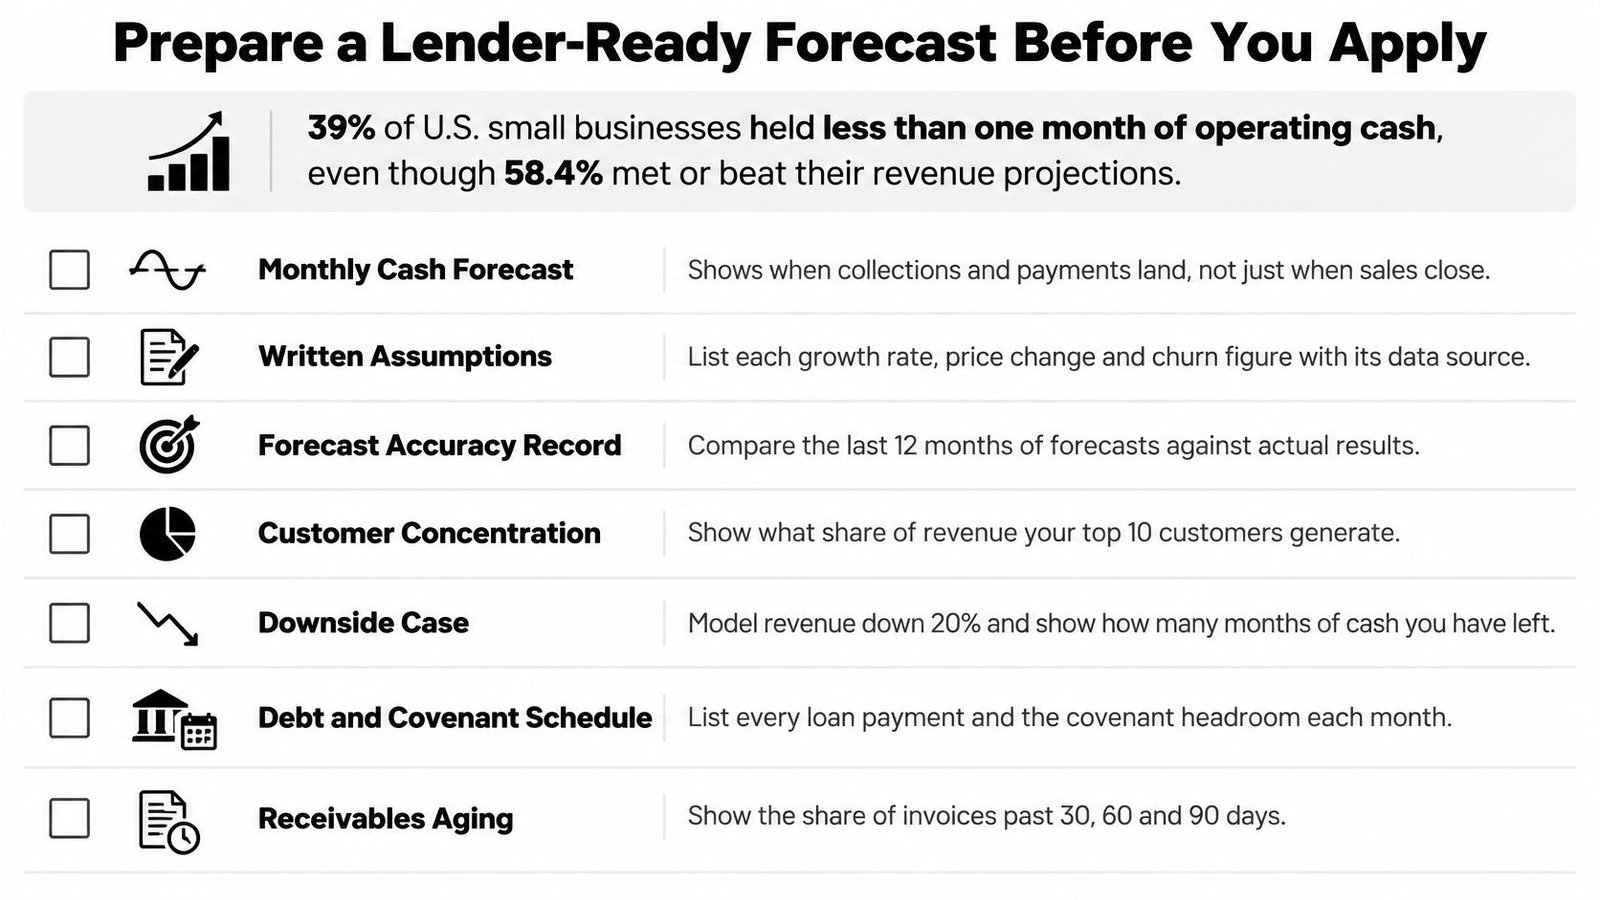
Prepare these items in order:
- Three scenarios: Show base, downside, and upside revenue, and name the trigger behind each case.
- A 13-week cash forecast: Show the specific week a gap appears, with collections, payroll, inventory purchases, and debt service.
- Forecast accuracy: Put historical forecast error next to projected revenue so a reader can judge the model's track record.
- Collection timing: List expected payment timing by customer and flag concentration, especially where a few accounts account for substantial sales.
- Cash protection: State your minimum-cash threshold and the week it's breached in the downside case.
Match the financing to the gap. A line of credit can suit a short seasonal dip when cash should recover as customers pay. Term debt is a better fit for a defined investment with a repayment period tied to the benefits it creates. Equipment financing links the borrowing to an asset used to generate revenue. If the downside case breaches minimum cash early, delaying expansion may be safer than financing an assumption that hasn't yet shown up in collections.
A forecast won't remove risk, but it can show the timing and scale of the funding need before you apply. For more ways to assess whether revenue is consistent enough to support borrowing, use this revenue consistency pressure-test guide.
Run the base case this week, find the first week of projected shortfall, and choose the funding type that covers that gap with margin.
Business Loan Warrior helps small businesses explore funding options designed for their needs, including lines of credit, equipment loans, and other financing options, through a single application. If your forecast points to a borrowing need, visit Business Loan Warrior to review available funding choices and prepare for the next step.