
You open your balance sheet because cash feels tighter than it should. Sales may be fine. Customers may be paying, eventually. But payroll is coming up, inventory needs restocking, and a lender just asked for your working capital number.
That's usually the moment owners realize net working capital isn't an abstract finance term. It's a practical measure of whether the business can keep moving without scrambling. If you know how to find net working capital, you can spot pressure early, clean up weak areas on the balance sheet, and walk into a funding conversation with a clearer story.
Table of Contents
- Why Net Working Capital Matters Before You Calculate It
- How to Find Net Working Capital With the Standard Formula
- Adjusting Your Calculation for Cash Restricted Funds and Debt
- Common Pitfalls That Distort Your Net Working Capital
- Sector Examples and Excel Walkthrough You Can Copy
- Interpreting Your Result and Improving Working Capital for Funding
Why Net Working Capital Matters Before You Calculate It
A lender asks for your working capital number before approving a line increase. Your P&L looks decent, but the balance sheet tells a different story. Cash is thinner than expected, receivables are aging, and inventory has crept up. That is why net working capital matters before you start plugging numbers into a formula.
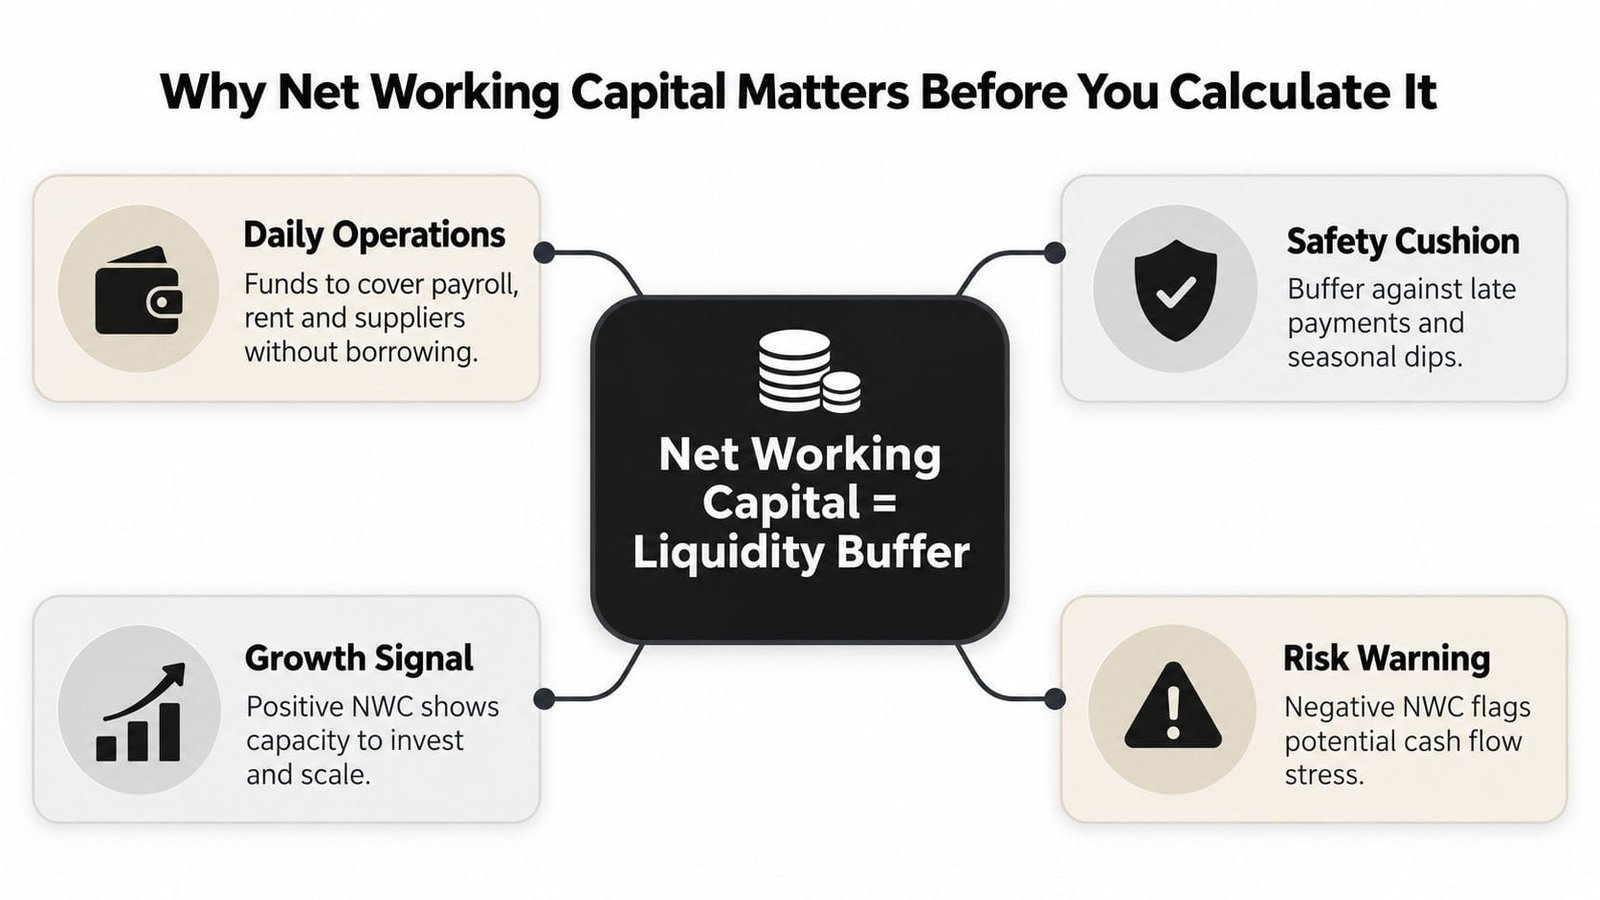
Net working capital measures the short-term resources your business has available after covering short-term obligations. In the textbook version, it is current assets minus current liabilities. In practice, lenders often go one step further and look at operating working capital, which strips out items like excess cash or short-term debt so they can judge how the business itself uses cash from one cycle to the next. CFI's overview of net working capital outlines both approaches.
A good way to read the number is to treat it like the amount of breathing room inside your operating cycle. If cash is tied up in invoices that have not been collected or stock that has not sold, the business can show accounting profit and still feel tight week to week.
For owners, that shows up in ordinary decisions:
- Payroll: Do incoming collections arrive in time to cover wages?
- Purchasing: Can you reorder materials or inventory without stretching payables?
- Vendor terms: Are you paying suppliers on time, or relying on extensions every month?
- Growth: Can you absorb a larger project or seasonal spike without outside cash?
If you want a broader plain-English foundation first, this guide to business working capital explains how owners use the concept in day-to-day decisions.
One point trips people up often. Positive net working capital is not automatically healthy, and negative net working capital is not automatically dangerous. A distributor may look weak because inventory is swelling ahead of demand. A grocery chain may run with low or even negative working capital because customers pay immediately while suppliers are paid later. The number only becomes useful when you connect it to the operating pattern of the business.
That is also why lenders care. They are not just asking, "What is the formula result?" They are asking whether your receivables, inventory, payables, restricted cash, and short-term obligations support repayment. The textbook number gives you a starting point. The adjusted operating number often plays a bigger role in underwriting, especially when a bank or SBA lender wants a cleaner view of liquidity tied to operations.
Before you calculate, keep that distinction in mind. It will help you pull the right balance sheet lines, avoid common misreads, and understand why your number may differ from the one a lender builds in Excel.
How to Find Net Working Capital With the Standard Formula
A lender asks for your latest working capital number before discussing terms. You open the balance sheet, see cash, receivables, inventory, payables, debt, payroll accruals, and a few lines that are less obvious. The standard formula gives you a clean starting point, as long as you pull the right totals from the same date and resist the urge to cherry-pick only the lines that look operational.
The textbook formula is:
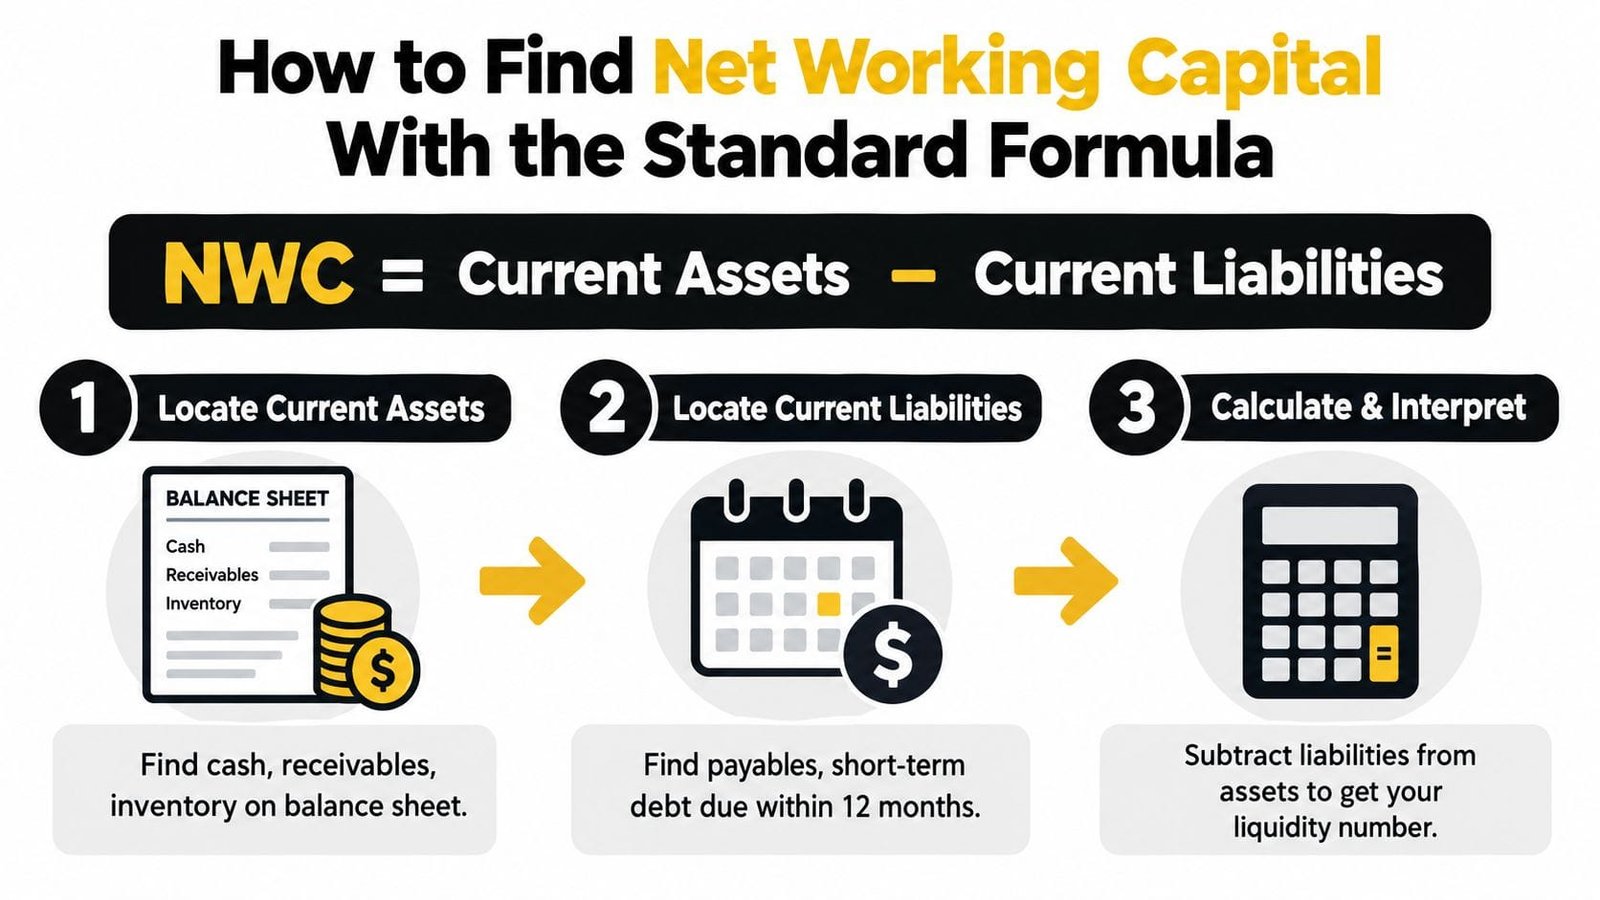
Net working capital = current assets – current liabilities
It is the balance-sheet version of asking, “If everything due within a year had to be covered by resources expected within a year, what cushion is left?”
Where to pull the numbers
Use a balance sheet for one reporting date, usually month-end. In QuickBooks, Xero, NetSuite, or a similar system, you need the totals for:
- Current assets
- Current liabilities
If you want a quick refresher on what a statement of financial position shows, Alignmint gives a useful plain-English explanation of how the balance sheet is organized.
Current assets are items expected to turn into cash, sell, or be used within 12 months. Current liabilities are obligations due within 12 months. For the standard calculation, use the accounting categories as presented on the balance sheet first. The lender-style operating adjustment comes later.
Current assets to include
The current asset section often includes:
- Cash
- Accounts receivable
- Inventory
- Prepaid expenses
- Other current assets
For this first pass, include the full current asset total. If a line looks unusual, such as a large deposit or a balance labeled “restricted,” make a note of it rather than changing the formula midstream.
Current liabilities to include
Current liabilities often include:
- Accounts payable
- Accrued liabilities
- Short-term notes
- Credit lines classified as current
- Current portion of long-term debt
- Taxes payable or other obligations due within a year
Owners often miss the last few items because they focus on vendor bills and stop there. A payroll tax balance or the current portion of term debt can change the answer enough to affect how a lender views short-term pressure.
Use figures from the same balance-sheet date. Mixing assets from one month-end with liabilities from another creates a number that looks precise but is not usable.
A short explainer can help if you want to hear the formula described verbally:
A simple example you can copy
Suppose your balance sheet shows:
| Line item | Amount |
|---|---|
| Cash | $90,000 |
| Accounts receivable | $140,000 |
| Inventory | $110,000 |
| Prepaid expenses | $10,000 |
| Total current assets | $350,000 |
| Line item | Amount |
|---|---|
| Accounts payable | $95,000 |
| Accrued payroll and taxes | $35,000 |
| Current portion of debt | $40,000 |
| Total current liabilities | $170,000 |
Your calculation is:
$350,000 – $170,000 = $180,000 net working capital
That means the business shows a $180,000 short-term cushion under the standard balance-sheet method.
How to do it quickly in Excel or from your accounting system
If you are answering a lender request or updating a monthly dashboard, keep the process simple:
- Run the balance sheet by date. Month-end usually gives the cleanest snapshot.
- Record total current assets. Start with the total before examining individual lines.
- Record total current liabilities. Confirm that accruals and current debt are included.
- Subtract current liabilities from current assets. The result is standard net working capital.
In Excel, many owners use three cells:
- B2: Total current assets
- B3: Total current liabilities
- B4:
=B2-B3
That layout matters because it mirrors how lenders review the number. They usually want the textbook result first, then an adjusted operating version in a separate line or tab so they can see what changed and why.
A ratio some lenders check alongside the dollar amount
After you calculate net working capital, you may also look at the current ratio, which is:
Current assets / current liabilities
Analysts often view a ratio above 1.0 as a sign that short-term assets exceed short-term obligations, while the “healthy” range depends on the business model and how quickly receivables convert to cash. Use the ratio as context, not as a substitute for the dollar calculation. A contractor, retailer, and manufacturer can post the same ratio and still have very different funding profiles based on how their working capital is tied up.
Adjusting Your Calculation for Cash Restricted Funds and Debt
The standard formula is useful, but it can blur what operations are really doing. A business can show healthy standard working capital because it's holding a large cash balance, while operations themselves are tight. Another business can look weaker than it is because current liabilities include debt that doesn't belong in an operating liquidity view.
That's why many analysts use operating net working capital.
Why the adjustment matters
The operating approach strips out items that can distort the day-to-day picture. The verified finance reference above notes that many analysts refine net working capital by excluding cash, marketable securities, and short-term debt to focus on operations.
In practice, that means the calculation leans more heavily on:
- accounts receivable
- inventory
- prepaid or other operating current assets
- accounts payable
- accrued operating liabilities
It removes financing and non-operating liquidity from the center of the picture.
Standard vs operating net working capital adjustments
| Line Item | Standard NWC | Operating NWC |
|---|---|---|
| Cash | Include | Exclude |
| Marketable securities | Include | Exclude |
| Accounts receivable | Include | Include |
| Inventory | Include | Include |
| Prepaid expenses | Include | Usually include if operational |
| Accounts payable | Include | Include |
| Accrued liabilities | Include | Include if tied to operations |
| Short-term debt | Include as current liability | Exclude |
| Current portion of long-term debt | Include as current liability | Often exclude from operating view |
| Restricted cash | May appear in current assets | Exclude if not available for operations |
A before-and-after example
Assume your current assets include a large cash balance from a recent owner capital contribution, and your current liabilities include a short-term note that financed equipment.
Standard net working capital may look strong. But that strength may come from financing, not from operations converting receivables and inventory efficiently.
Operating net working capital tells a narrower story:
- remove cash that isn't part of the operating cycle
- remove restricted funds that can't pay ordinary bills
- remove short-term debt that reflects financing structure rather than operating payables
A lender looking at operating liquidity wants to know whether the business itself is generating breathing room, not whether cash was temporarily added from outside.
What owners most often mis-handle
A few line items deserve extra care:
- Restricted cash: If those funds can't be used for payroll, rent, or suppliers, exclude them from an operating view.
- Owner-related asset balances: Sometimes books carry odd current asset entries tied to draws, reimbursements, or temporary advances. Review whether they're collectible and operational.
- Current portion of long-term debt: For standard NWC, it belongs in current liabilities. For operating NWC, many lenders back it out to isolate operational pressure.
- Short-term notes and revolver balances: These often belong in standard NWC, but many analysts remove them when measuring operating working capital.
If your debt classifications are messy, a clean debt schedule for your business makes this adjustment much easier.
Common Pitfalls That Distort Your Net Working Capital
Most net working capital mistakes don't come from bad math. They come from bad inputs.
A balance sheet can look tidy and still tell the wrong story if inventory is stale, receivables won't collect, or debt is sitting in the wrong bucket. That matters most when you're using the number to make a funding decision.
The quality of assets matters as much as the total
A retailer may show strong current assets because inventory is high. But if part of that stock hasn't moved in months, the balance sheet may overstate liquidity.
A service firm may have minimal inventory and still look healthy, unless receivables are aged and unlikely to convert into cash soon. Construction businesses often run into another variation. They may carry contract-related receivables, retainage, or timing-heavy billings that need careful review before you trust the working capital number.
Here's a practical checklist:
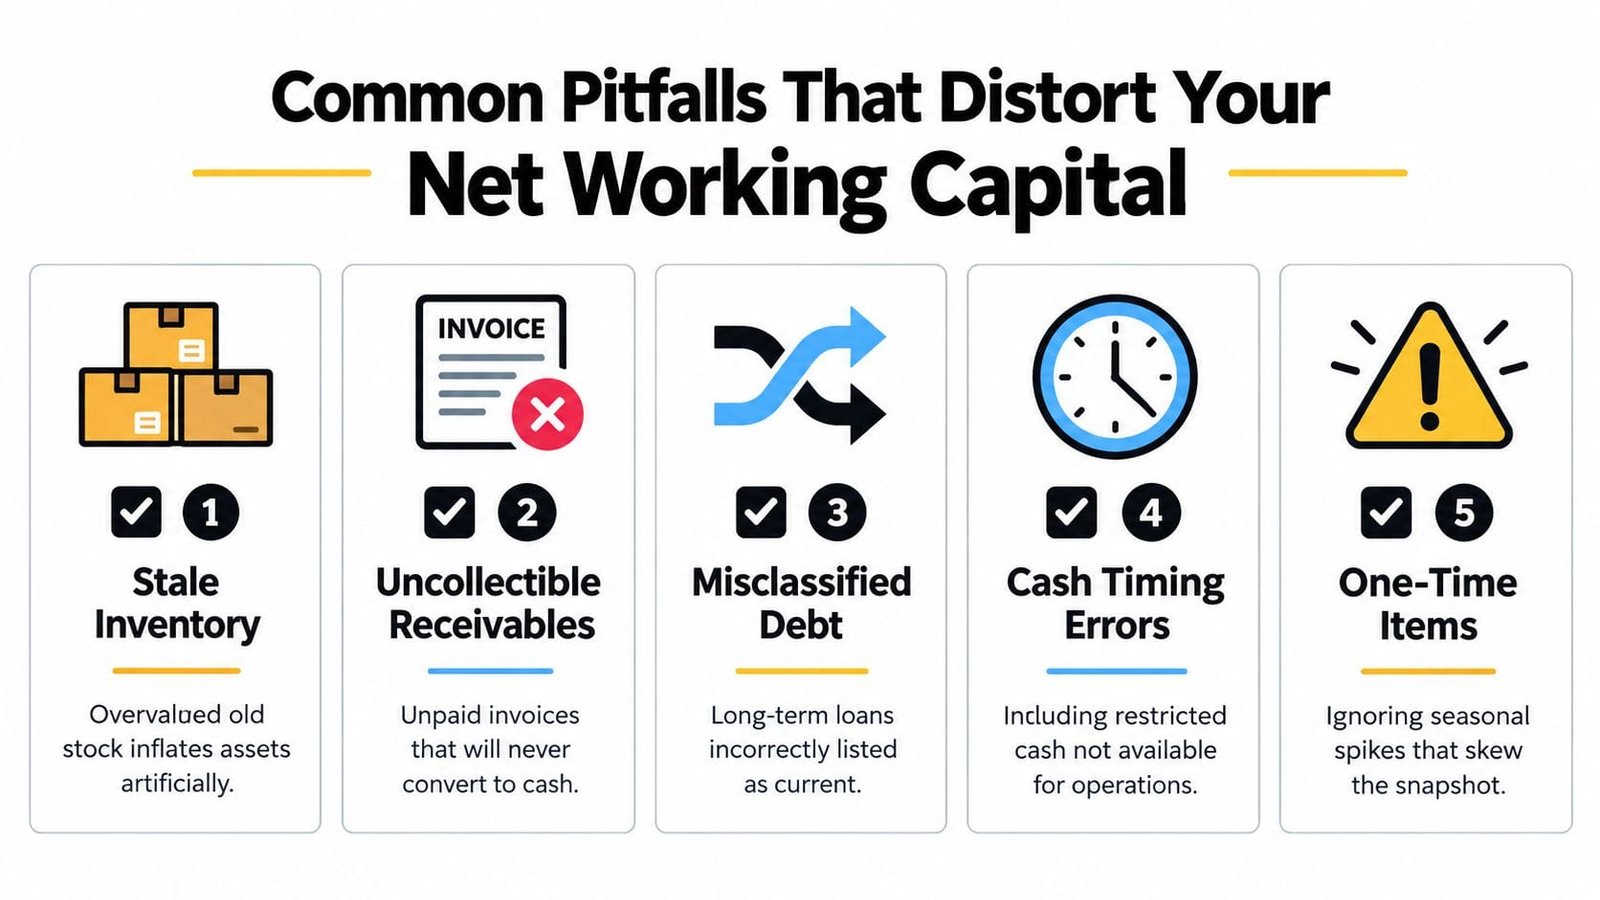
- Stale inventory: Old stock inflates current assets but may not support near-term cash needs.
- Weak receivables: Large invoices don't help if the customer is slow-paying or disputing them.
- Misclassified liabilities: Long-term obligations sometimes get lumped into current liabilities, or the reverse.
- Cutoff issues: Bills entered late or receivables posted early can swing month-end working capital.
- One-time prepaids or unusual deposits: These can make current assets look stronger than operating reality.
Sector differences change the meaning
The same formula can lead to very different conclusions depending on the business model.
| Sector | Common balance-sheet pattern | What to watch |
|---|---|---|
| Retail | Inventory-heavy current assets | Slow-moving stock and seasonal build |
| Services | Receivables-heavy current assets | Collection speed and write-off risk |
| Construction | Mixed receivables, payables, and job timing items | Classification and timing around billing cycles |
Don't compare your number casually to a company in a different sector. The formula is universal, but the balance-sheet shape isn't.
A cleaner way to sanity-check the snapshot
If one month looks unusually strong or weak, don't rush to conclusions. Pull a short trend view and compare several recent month-end balances.
Many owners use a rolling average across recent months to smooth out timing distortions, especially when inventory purchases, customer billing, or payroll cycles make one date look abnormal. That won't replace the actual month-end figure, but it helps you decide whether the result reflects normal operations or a temporary blip.
Sector Examples and Excel Walkthrough You Can Copy
Two companies can have the same formula and very different operating realities.

Example one: a retailer
A retailer usually carries a larger inventory balance than a consulting firm or agency. That means current assets may look solid, but the key question is whether the stock turns fast enough to support cash flow.
If inventory rises ahead of a selling season, standard net working capital may increase. That can be perfectly reasonable. But if sales lag, the business may look liquid on paper while cash gets trapped on shelves.
For a retailer, I'd review:
- inventory by category or aging
- accounts payable terms with key vendors
- whether receivables are even meaningful, since many retail models are cash or card-heavy
Example two: a service business
A service company often has little inventory. Its working capital story usually sits inside receivables, unbilled work, accrued payroll, and payables.
That means a service firm can post positive net working capital while still feeling squeezed if billing is slow or collections are sloppy. In these businesses, one overdue customer can distort the month.
A service owner should focus on:
- invoice timing
- customer concentration
- receivables aging
- accrued compensation or taxes not yet paid
A simple Excel layout
You don't need a fancy model. A plain worksheet works fine if it's consistent.
Set up columns like this:
| A | B | C | D |
|---|---|---|---|
| Month | Current Assets | Current Liabilities | Net Working Capital |
Then populate each row by month-end.
Use a formula in column D:
=B2-C2
If you want an operating version, add more columns:
| A | B | C | D | E | F | G |
|---|---|---|---|---|---|---|
| Month | Current Assets | Current Liabilities | Cash | Short-Term Debt | Standard NWC | Operating NWC |
Then use:
- Standard NWC:
=B2-C2 - Operating NWC:
=(B2-D2)-(C2-E2)
That second formula removes cash and short-term debt from the operating view.
Keep your export structure the same every month. Consistency matters more than sophistication.
How to make the sheet decision-ready
Add one chart. A basic line chart with monthly net working capital is enough to show trend direction. If the line is drifting down while sales are rising, that often means growth is consuming working capital faster than the business is replenishing it.
A few practical formatting ideas help too:
- Freeze the top row so headings stay visible.
- Color-code inputs and formulas if multiple people touch the file.
- Add a notes column for one-off events, like a large inventory buy or delayed customer payment.
- Reconcile to the balance sheet total each month before sharing the file.
If you want to speed up formula work, this roundup of Excel formula shortcuts on Cloudvara is handy for owners building reports themselves.
What to copy into Google Sheets
The same structure works in Google Sheets. The only real difference is workflow. Sheets is often easier when your controller, bookkeeper, and owner all need to look at the same file without emailing versions around.
The important part isn't the software. It's that your file separates standard NWC from operating NWC and preserves a month-by-month history you can explain.
Interpreting Your Result and Improving Working Capital for Funding
A business owner pulls a balance sheet the night before sending a loan package. Net working capital is positive, so the first reaction is relief. Then the lender asks a harder question: how much of that liquidity comes from day-to-day operations, and how much comes from cash sitting in the bank or short-term borrowing?
That is the point of interpretation. The textbook number answers one question. The operating version answers the question an underwriter often cares about most: can the business support itself through its normal cash cycle?
A positive result is usually a healthy starting point. It means current assets are higher than current liabilities on paper. A negative result means near-term obligations are heavier than near-term resources, which can put pressure on payroll, vendors, or debt payments. But lenders rarely stop at the raw figure. They look at what is inside it.
What lenders are trying to understand
A lender is usually reading your working capital in context, not in isolation. Positive standard net working capital can still raise concern if receivables are old, inventory is slow, or cash is inflated by a recent owner injection. Weak standard net working capital can be easier to explain if collections are fast, inventory turns quickly, and payables are stable.
Many credit teams also compare your net working capital with your current ratio. The ratio helps them see whether your cushion is thin, comfortable, or excessive. Excess cash can make the ratio look better without improving the operating engine. That is why your operating adjustment matters in funding conversations.
If you are weighing options tied to short-term liquidity, a guide to working capital financing for businesses helps connect the balance-sheet result to the kind of funding that fits the pressure point.
How to read the result without fooling yourself
Use these patterns as a practical read:
- Positive standard NWC and positive operating NWC: Usually the cleanest picture. Current assets cover current liabilities, and the operating cycle is contributing instead of depending on outside support.
- Positive standard NWC but weak operating NWC: Often a sign that cash balances or short-term financing are masking strain in receivables, inventory, or payables.
- Negative standard NWC but stable cash conversion: Common in some efficient models, especially where customers pay quickly and suppliers offer longer terms. Trend and account quality matter more here than one snapshot.
- Negative in both versions: A lender will usually ask what changed, how quickly it can be corrected, and whether financing will solve a timing issue or cover a deeper margin problem.
One month never tells the whole story.
Three to twelve months of trend data gives a much better answer, especially if you line it up with sales growth, inventory purchases, and borrowing activity. A business can show a decent number at month-end and still struggle during the middle of the month if collections are uneven.
Practical ways to improve working capital before a funding review
Owners usually improve the number by tightening the cash cycle, cleaning up balance-sheet quality, or changing how short-term obligations are structured.
- Collect receivables faster. Invoice promptly, shorten follow-up time, and escalate old balances before they drift into chronic aging.
- Reduce inventory that is tying up cash. Dead stock makes current assets look stronger than they really are because it may not convert to cash on the timetable your lender expects.
- Stretch payables carefully. Better terms can help, but late payments that damage supplier relationships can create a new operating problem.
- Move short-term pressure out of current liabilities where appropriate. Refinancing a maturity wall can improve the near-term picture, but lenders will still check whether operations are generating enough working capital on their own.
- Separate one-time support from recurring performance. Owner deposits, emergency draws, and seasonal cash infusions should be easy to identify and explain.
Sector details matter here. A wholesaler may need to fix inventory mix before anything else. A service firm may need to focus almost entirely on billing speed and collections. A contractor may need to explain retainage and timing gaps so receivables are not judged too harshly.
What a fundable story looks like
The strongest funding requests do not just show a number. They explain why it looks the way it does, what has improved over the last few months, and which items deserve an adjustment.
A clear explanation might sound like this: receivables rose because two large customers were billed at quarter-end, collections landed the following month, slow inventory was written down, and a short-term note was refinanced so current liabilities now match the operating cycle more closely. That kind of explanation gives an underwriter something concrete to work with.
Good analysis does not guarantee approval. It does make the file easier to trust.