
Break even analysis is the calculation that tells a business exactly how many units or dollars in sales it needs to cover all fixed and variable costs, meaning zero profit and zero loss at that point. For example, with $120,000 in annual fixed costs, a $40 selling price, and $25 variable cost per unit, the break-even point is 8,000 units because each sale contributes $15 toward fixed costs. That’s the simple answer, but its value is what it tells you before you sign a lease, order inventory, or borrow money you may not be able to carry.
Maybe you’re looking at a new product line, a bigger space, or a loan offer that sounds workable on paper. The question underneath all of it is the same, can this business cover its costs at the sales level you can realistically reach? Break-even analysis gives you a clean starting point for that decision, and it becomes much more useful when you connect it to pricing, demand, cash flow, and funding timing.
Table of Contents
- Why Every Small Business Owner Needs Break Even Analysis
- The Break Even Formulas You Actually Need
- A Step by Step Break Even Example for Small Businesses
- Margin of Safety and Sensitivity Analysis
- Common Pitfalls and Limitations of Break Even Analysis
- Using Break Even Analysis to Make Smarter Lending Decisions
- Your Break Even Analysis Action Checklist
Why Every Small Business Owner Needs Break Even Analysis
A bakery owner renews a lease, a contractor considers hiring another crew member, and a retailer debates whether a new product line deserves shelf space. In each case, the first question is not “Will this look good on paper?” It’s “Can I sell enough to pay for it?”
Break-even analysis answers that question in plain language. It shows the exact sales volume or revenue needed to cover all costs, which is the point where the business makes no profit and no loss. The U.S. Small Business Administration places break-even directly into startup planning because it helps owners test whether a pricing plan and cost structure work, not just whether they sound reasonable. You can see that framing in the SBA’s guidance on the break-even point and its standard formulas for units and sales dollars. SBA break-even point guidance
Why owners use it before they commit
The best use of break-even analysis is early. Before you lock in a lease or sign for financing, it helps you see how much pressure a new fixed cost will put on the business. If the number looks too high, you can step back and rethink price, volume, or timing.
Practical rule: If a decision adds fixed cost, run the break-even math before you say yes.
It also gives you a baseline for sales forecasting. If you’re already building projections, pairing that work with Stamina’s sales forecasting insights can help you compare what you hope to sell with what you must sell. That gap is where a lot of small business decisions get either approved or rejected.
A strong break-even model also helps you avoid a common mistake, confusing busy with profitable. A shop can be full of customers and still miss break-even if prices are too low or variable costs are too high. That’s why seasoned owners treat break-even as a filter, not a finish line.
The Break Even Formulas You Actually Need
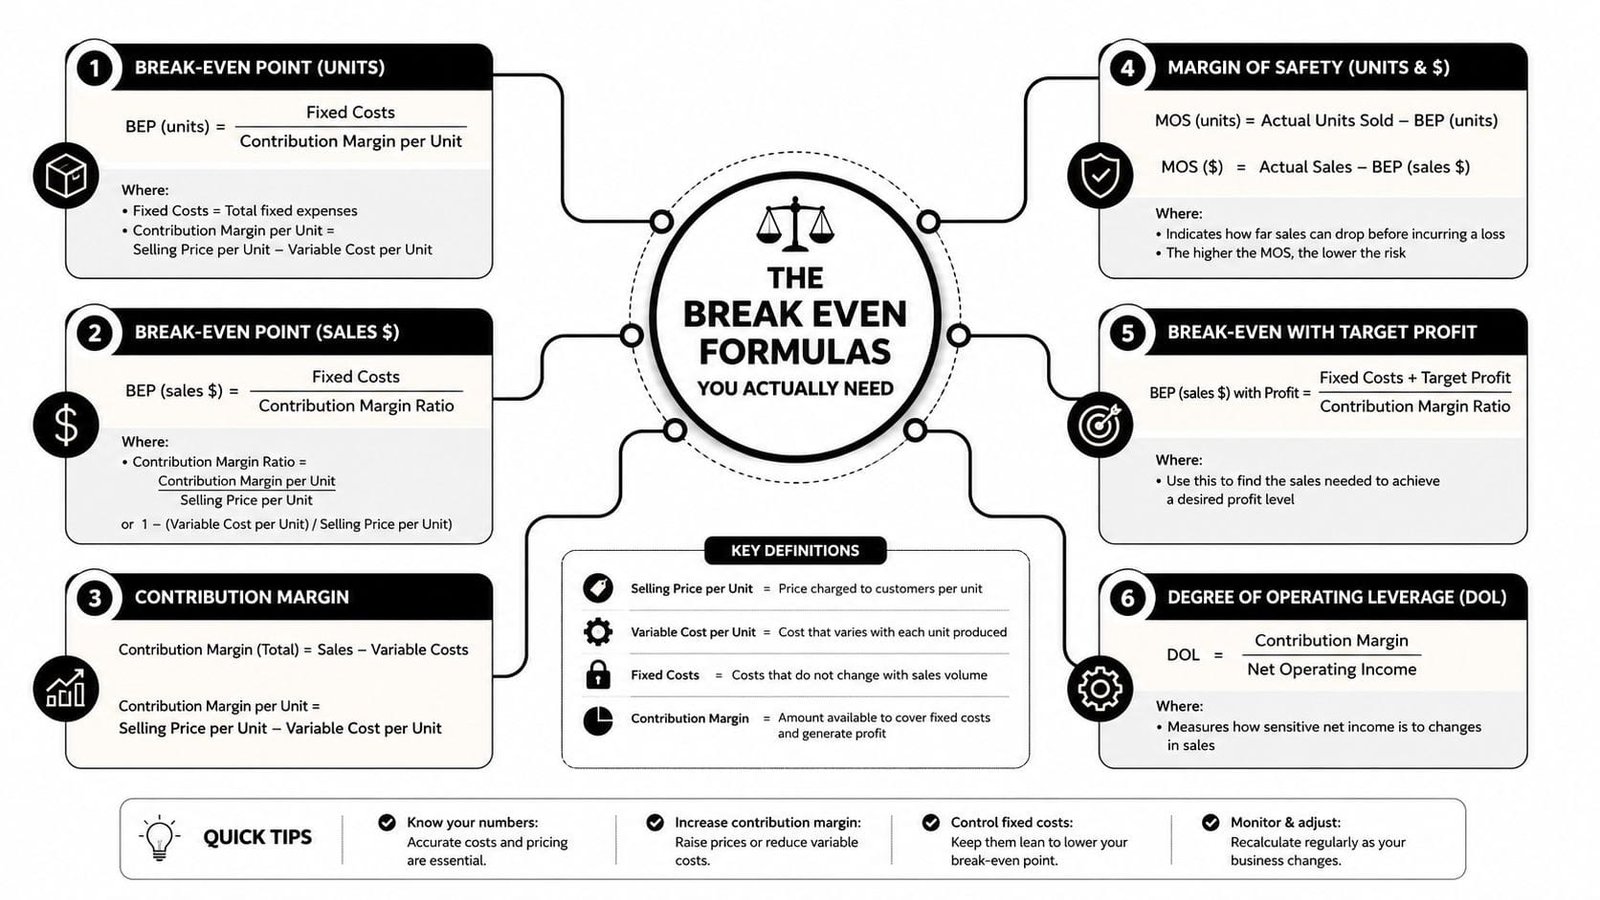
The simplest way to understand break-even is to split each sale into two parts. One part covers the cost of making or delivering that sale. The other part helps pay down fixed costs like rent, insurance, and salaried staff.
The SBA states the standard formula as Break-even point (units) = fixed costs ÷ (sales price per unit minus variable cost per unit), and also gives the sales-dollar form break-even point (sales dollars) = fixed costs ÷ contribution margin. SBA break-even point guidance Yale School of Management also frames break-even as the point where a business earns zero dollars in profit, with the concept commonly split into break-even revenue and break-even quantity. Yale School of Management breakeven primer
The four inputs you need
Fixed costs stay the same whether you sell one unit or one thousand. Think rent, insurance, and salaries that don’t move with volume.
Variable costs rise with each sale, such as packaging, materials, shipping, or direct labor tied to production.
Selling price per unit is what the customer pays for one item or one service unit.
Contribution margin is the amount left after variable cost is removed from the selling price.
That last one matters most. If you sell something for $40 and the variable cost is $25, the contribution margin is $15 per unit. That means every sale contributes $15 toward fixed costs before profit starts.
If you’re still sorting out overhead categories, the guide for contractor pricing is useful because it shows how owners think about overhead before they even get to break-even math. For a separate walkthrough on overhead structure, this overhead cost guide can also help you classify costs before you plug them into the model.
Practical rule: If you can’t separate fixed and variable costs clearly, your break-even number is only a rough estimate.
A Step by Step Break Even Example for Small Businesses
A small specialty coffee shop has the kind of cost structure that makes break-even analysis easy to see. Rent, insurance, and a few salaried roles create the fixed base. Beans, cups, lids, and payment processing create the variable side.
Walk the numbers through once
Start with the inputs. Annual fixed costs are $120,000. Each drink sells for $40, and the variable cost per drink is $25. That gives you a $15 contribution margin per unit.
Now divide fixed costs by that margin. $120,000 ÷ $15 = 8,000 units. That means the shop must sell 8,000 drinks just to hit break-even. Before that point, the business is still absorbing losses. After that point, each additional sale contributes to profit.
The sales-dollar version tells the same story from a different angle. If each unit contributes $15 on a $40 sale, the business is using contribution margin to recover fixed cost through revenue. The SBA’s sales-dollar form is the clean way to translate the unit answer into top-line sales planning.
Here’s the same model in a compact view.
| Metric | Scenario A | Scenario B |
|---|---|---|
| Fixed costs | $50,000 | $100,000 |
| Contribution margin per unit | $10 | $10 |
| Break-even volume | 5,000 units | 10,000 units |
That second scenario shows the core relationship clearly. If fixed costs double while contribution margin stays the same, the break-even volume doubles too. NetSuite’s break-even analysis overview highlights this relationship because it’s why fixed costs matter so much in manufacturing, restaurants, and distribution. NetSuite break-even analysis
A useful habit is to translate the number into operating reality. Eight thousand units a year might sound manageable until you divide it by the number of sales days you have. That’s when owners start seeing whether the model fits their real capacity.
Margin of Safety and Sensitivity Analysis
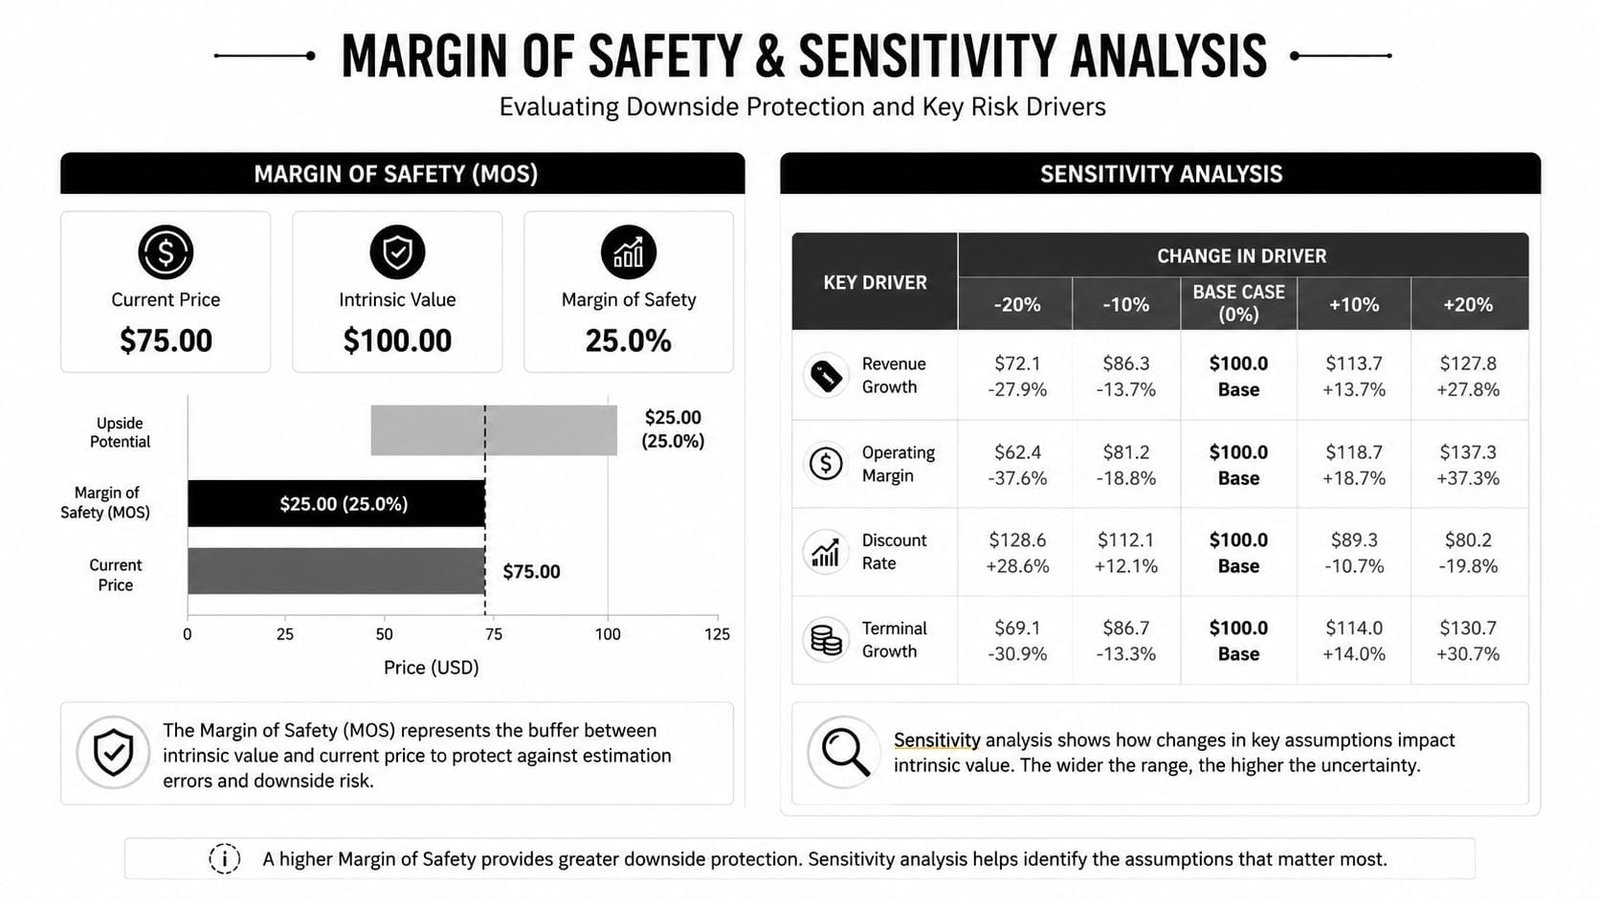
Break-even tells you where the line is. Margin of safety tells you how much room you have before you fall below it. That gap matters because a business with a thin cushion can look healthy right up until one weak month pushes it into loss.
How to think about cushion
The idea is simple, actual or forecast sales minus break-even sales equals the margin of safety in dollars. The percentage version compares that gap to actual or forecast sales. Patriot Software’s break-even guide explains the concept as the space between sales and the break-even point, which is why lenders and owners both watch it closely. Patriot Software break-even guide
A large cushion gives you flexibility. A small cushion means you have less room for discounting, supply shocks, or a slow season. That’s why a business can hit break-even on paper and still feel fragile in practice.
Stress test the variables that move most
Sensitivity analysis asks, “What happens if one number changes?” A supplier price increase changes variable cost. A promotion changes selling price. A lease renewal changes fixed cost. Each one shifts the break-even point, sometimes enough to change a decision entirely.
If you manage a service business and want to see how analysis supports decisions beyond simple accounting, business analytics for UK service businesses offers a useful perspective on turning numbers into action. The principle is the same here, you’re not chasing a perfect forecast, you’re checking which assumptions are fragile.
Small changes in price or cost can move break-even farther than owners expect, so test the assumptions that matter most before you borrow or expand.
Common Pitfalls and Limitations of Break Even Analysis
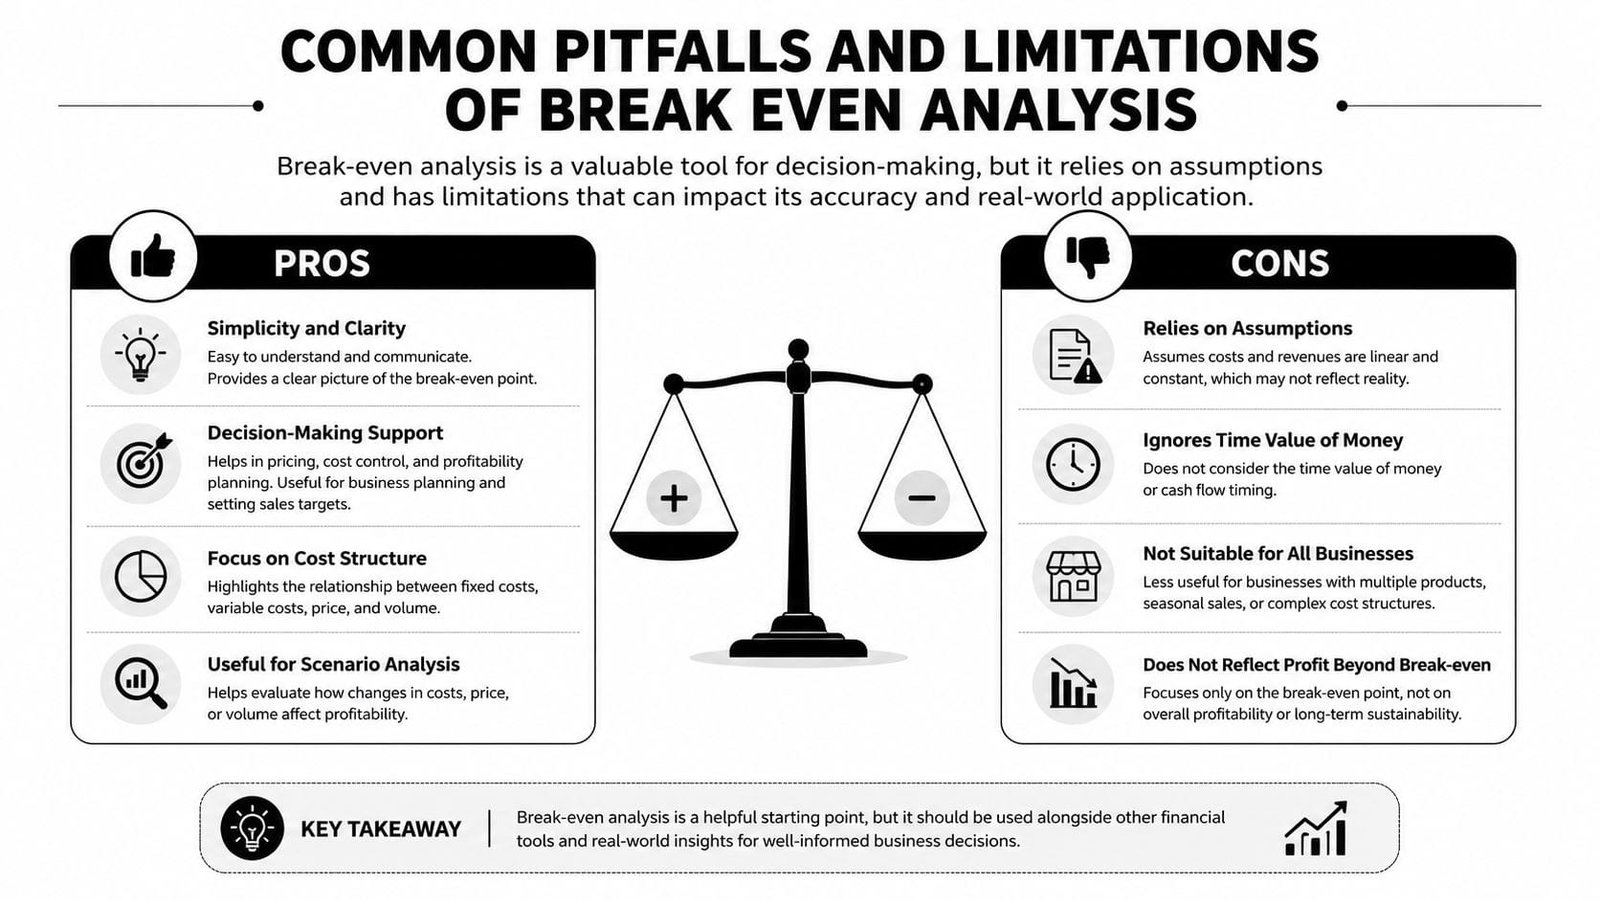
Break-even analysis is useful because it’s simple. It becomes dangerous when owners mistake that simplicity for certainty. The formula works best when costs are easy to classify and sales volume is stable enough to model with confidence.
Where the model starts to bend
Many costs are not neatly fixed or variable. Some are step-fixed, which means they stay flat until the business crosses a threshold and then jump. Others are semi-variable, with a base charge plus a usage component. That makes the break-even estimate directional, not exact.
Demand is another limitation. The model can tell you what you must sell, but it can’t tell you whether the market will buy that much. Seasonal businesses feel this fast because one strong period can hide a weak one, even though the year still falls short overall.
The Yale primer on breakeven analysis is useful here because it notes that real-world decisions often need more than the core formula, especially when cash timing, uncertainty, and borrowing are part of the picture.
Why cash timing changes the answer
A business can look profitable on paper and still run out of money. Customers may pay later than suppliers do, inventory may sit too long, and loan repayments may create pressure before break-even arrives. That’s why break-even is not a substitute for cash flow forecasting.
For a deeper look at forecasting through the cash lens, the business analytics for UK service businesses discussion is a good complement, because it reinforces the idea that planning has to include timing, not just totals. Break-even shows the threshold. Cash flow shows whether you can survive the climb.
Using Break Even Analysis to Make Smarter Lending Decisions
Break-even analysis is one of the best tools for sizing a loan request because it ties funding to operating reality. If a business needs months of ramp-up time before sales cover costs, the owner should think about how much cash is required to survive that period, not just how much is needed to buy equipment or open the doors.
A lender wants to see that the borrower understands the relationship between fixed costs, sales volume, and debt service. A break-even model gives that conversation structure. If the business can only break even after a long runway, borrowing too early may add pressure instead of relief.
Use the break-even point to size working capital
A useful way to think about funding is simple. If the business needs time to reach break-even, then working capital has to cover the gap between launch and that point. That means enough liquidity for payroll, rent, inventory, and loan payments while sales build.
Practical rule: Fund the time to break-even, not just the purchase you want to make.
Owners often underborrow. They ask for the equipment or the buildout cost, but not for the cash needed to carry the business until sales catch up. A realistic loan plan includes both.
If you’re building that bridge, the cash flow forecast guide for your loan strategy can help connect break-even math to repayment planning. That pairing matters because loan underwriting is never just about whether the deal looks attractive. It’s about whether the business can keep paying when sales are uneven.
Know when the loan makes sense
Break-even can support borrowing when demand is there but capacity is the limit. It can also warn you off when the business hasn’t yet proven it can sell above the threshold. In other words, if sales are still below break-even and you’re asking debt to solve a demand problem, the loan may deepen the hole.
Used well, break-even analysis helps you present a funding request with discipline. You’re not just asking for money, you’re showing how the money fits into the path to stability.
Your Break Even Analysis Action Checklist
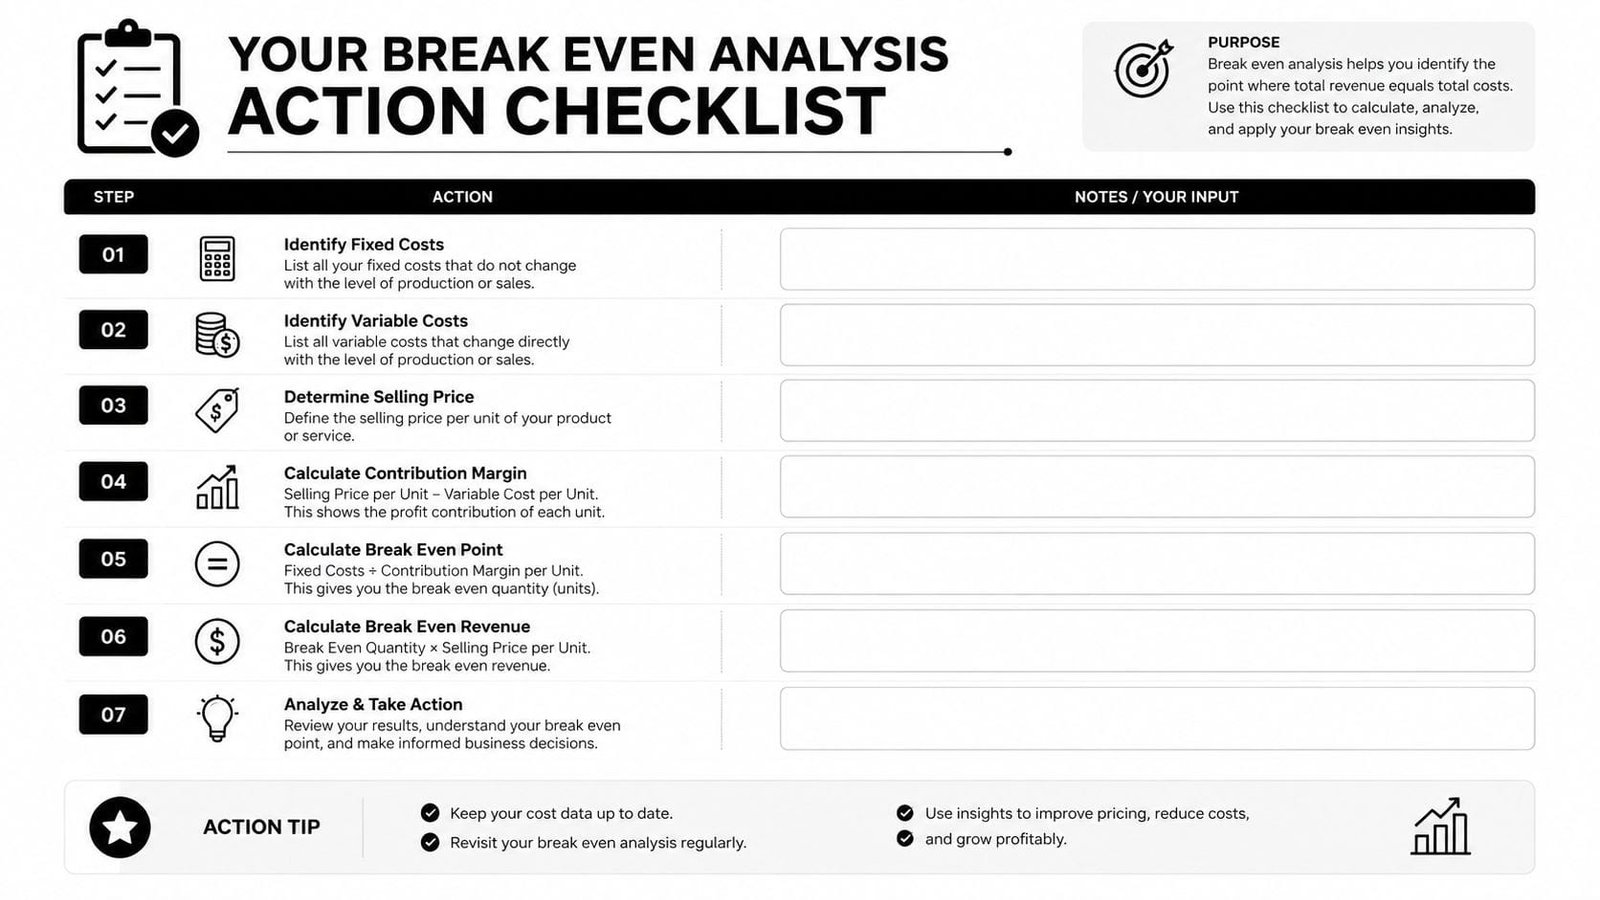
Use this checklist before you launch, borrow, or add a fixed cost:
- List fixed costs carefully. Include only costs that really stay steady in the period you’re modeling.
- Classify variable costs. If a cost rises with each sale, put it on the variable side.
- Calculate contribution margin. Subtract variable cost per unit from selling price per unit.
- Run both formulas. Calculate break-even in units and in sales dollars.
- Compare to forecast sales. Measure your cushion before you commit.
- Stress-test two downside cases. Try a cost increase and a sales slowdown.
- Check cash runway. Make sure the business can survive long enough to reach break-even.
Revisit the model after a price change, a supplier increase, a lease renewal, or a shift in demand. Break-even analysis works best when it stays current, because stale assumptions create false comfort.
If you want a clearer path from break-even math to actual funding decisions, Business Loan Warrior can help you compare financing options with the numbers in front of you. Use your break-even point as the starting line, then visit the site to find lending options that fit your sales reality, not just your wish list.