

Sales can climb while cash still feels tight. That usually means the problem isn't revenue. It's the cost of keeping the business running in the background.
Most owners know their direct costs well enough. They know what labor, materials, inventory, or subcontractors cost. Where the confusion starts is everything else: rent, software, insurance, admin payroll, warehouse expense, plant supervision, utilities, compliance, and all the other bills that don't attach neatly to one sale. Those costs are overhead, and if you don't calculate them correctly, your pricing gets soft, your margins get blurry, and your loan package looks weaker than it should.
A lot of businesses stop at a simple percentage and call it done. That's better than guessing, but it's not enough once you have multiple products, locations, channels, or projects. Significant value comes from learning how to calculate overhead cost in a way that shows which parts of the business earn money and which ones only look profitable on the surface.
Table of Contents
- Why Overhead Is Your Businesss Silent Partner
- Identifying Your Indirect Costs A Complete Checklist
- The Core Calculation Summing Expenses and Finding Your Rate
- Allocating Overhead for True Profitability Insights
- Real-World Examples Restaurant Retail and Construction
- Common Pitfalls and Using Overhead Data for Growth
Why Overhead Is Your Businesss Silent Partner
A business owner usually notices overhead when the profit and loss statement starts arguing with intuition. Sales look solid. Work is moving. The team is busy. Yet profit doesn't rise the way it should.
That's because overhead acts like a silent partner. It takes a share of every dollar, whether you think about it or not. It doesn't show up in the glamour spots of the business. It sits in the background and collects rent, utilities, admin support, subscriptions, insurance, and all the other costs required to keep operations standing.

Owners who build a strong business operating system usually get control of overhead faster because they stop treating expenses as random noise. They start treating them as managed inputs.
Why overhead matters more than most owners think
If you understate overhead, you underprice. If you overstate it, you can scare yourself away from good opportunities. In both cases, decision-making gets worse.
The issue becomes more serious as the company scales. A small pricing mistake on a handful of jobs is irritating. The same mistake across multiple service lines, products, crews, or channels becomes expensive. It also makes budgeting and forecasting less reliable because the cost structure underneath the plan isn't clean.
Practical rule: If your gross margin looks respectable but net income feels disappointing, overhead is one of the first places to investigate.
Why this matters for profitability and financing
Lenders don't just care that revenue exists. They care whether management understands the business well enough to protect cash flow. Clean overhead reporting helps support that story.
A borrower who can explain fixed overhead, changing overhead, and how those expenses are allocated across products or projects is easier to underwrite than a borrower who only says, “expenses have gone up.” One sounds like an operator. The other sounds like someone reacting after the fact.
That's the reason to learn how to calculate overhead cost properly. It helps you price with confidence, protect margin, and present a stronger financial picture when you need working capital, equipment financing, a line of credit, or an SBA-backed loan.
Identifying Your Indirect Costs A Complete Checklist
The first mistake most businesses make is simple. They mix direct costs with overhead and then wonder why their numbers feel wrong.
The cleanest way to think about it is this. Direct costs are the ingredients in the dish. Overhead is the cost of running the kitchen. One goes into a specific sale. The other supports the environment that makes the sale possible.
Direct costs versus overhead
If a cost rises because you produced one more unit, served one more customer, or staffed one more billable job, it's probably direct. If the business would still owe that cost even if output paused for a bit, it's probably overhead.
The standard formula is Overhead Cost = Indirect Materials + Indirect Labor + Indirect Expenses, as explained in QuickBooks' overhead cost guide. The same source gives a simple example: $15,000 in indirect materials, $25,000 in indirect labor, and $10,000 in indirect expenses equals $50,000 in total overhead for the month.
That formula is useful because it forces discipline. Instead of saying “everything that's not inventory,” you sort costs into buckets and review them intentionally.
Rent for the building is overhead. The flour in the bread is direct cost. If you confuse the kitchen with the ingredients, your menu pricing won't hold.
It also helps to classify overhead by behavior:
- Fixed overhead stays largely steady, such as rent or base insurance.
- Variable overhead shifts with activity, such as supplies used across operations.
- Semi-variable overhead has a base cost plus usage swings, such as many utility bills.
For owners who want another practical framework for sorting recurring business costs, this agency operating expense guide is a useful companion because it helps you think through expenses operationally, not just academically.
A practical overhead checklist
Before you calculate anything, pull a monthly expense detail report and mark each line item as direct or indirect. Then sort the indirect items into categories. Reviewing your P&L statement clearly makes this much easier because many misclassifications start with messy chart-of-accounts habits.
Here's a checklist you can use.
| Expense Category | Fixed Overhead | Variable Overhead | Semi-Variable Overhead |
|---|---|---|---|
| Facilities | Rent, property insurance | Cleaning supplies | Utilities with base service plus usage |
| Administration | Salaried office management | Temporary office support | Overtime for admin team |
| Technology | Core software subscriptions | Per-user software add-ons | Communication tools with base plans and usage charges |
| Operations support | Equipment leases | Shop supplies, general consumables | Repairs and maintenance that vary by workload |
| Sales and service support | Base office phones | Packaging and shared shipping supplies | Mixed service plans tied partly to activity |
| Compliance and professional services | Basic insurance premiums, recurring accounting retainers | Filing or transaction-related charges | Legal or consulting support with standing fees plus project work |
A few classification reminders matter:
- Indirect materials include items the business uses broadly but doesn't sell as part of the finished product.
- Indirect labor includes supervisors, admin staff, maintenance, schedulers, and other support roles not tied directly to one sale.
- Indirect expenses include occupancy, utilities, insurance, depreciation, office operations, and similar support costs.
Don't obsess over making the first pass perfect. Start with consistent logic. If a line item is debatable, document why you placed it where you did. Consistency month to month usually matters more than pretending every allocation is mathematically pure.
The Core Calculation Summing Expenses and Finding Your Rate
Once your indirect costs are identified, the math itself is straightforward. Its value lies in doing it consistently and reading the result correctly.
Early in the process, I tell owners to stop hunting for a magic formula. There isn't one. There's a clean method, repeated month after month, with better decisions flowing from it.
Here's the visual version of that process.
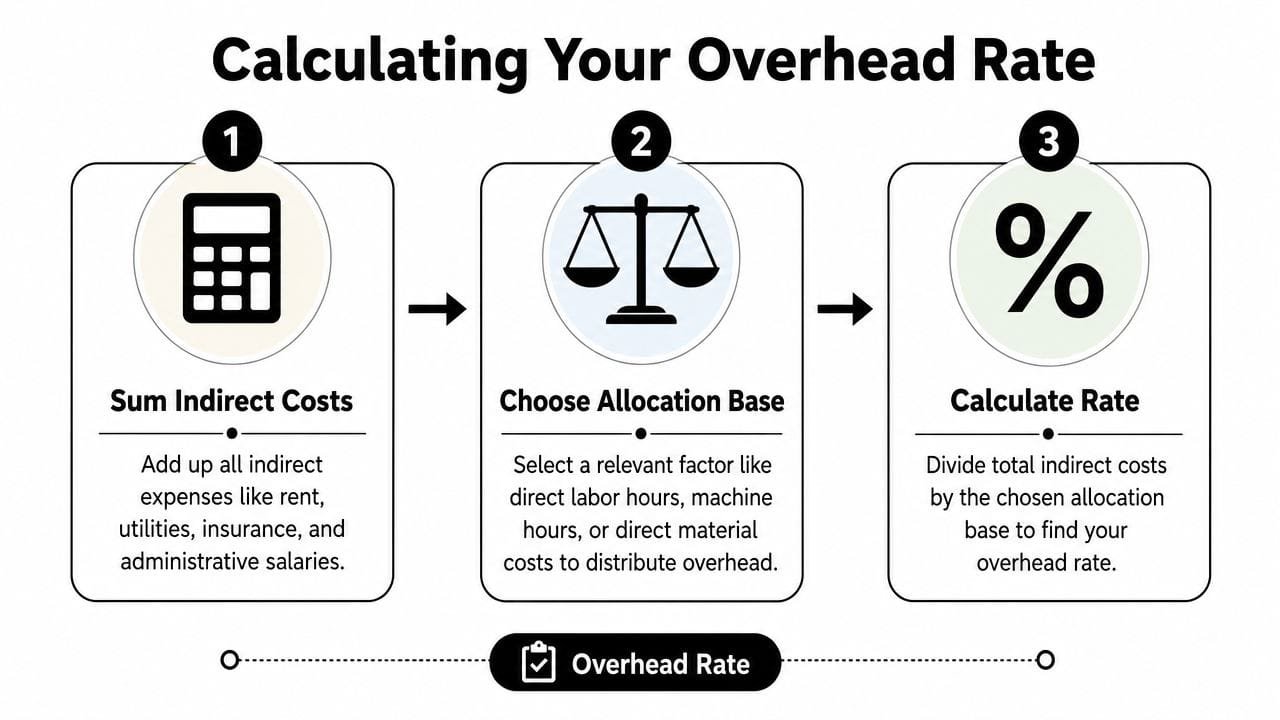
The three-part calculation
The standard methodology involves three steps: identify all indirect expenses, aggregate them for the period, and apply the overhead rate formula (Total Overhead Costs ÷ Total Direct Costs or Sales) × 100, as outlined in Wall Street Prep's overhead cost explanation.
For most small business owners, the practical workflow looks like this:
- Gather one period of indirect expenses. Monthly is usually the cleanest starting point.
- Add them together. That gives you total overhead for the month.
- Divide by sales and multiply by 100. That gives you your overhead percentage.
A lot of operators understand this faster when they compare it to a restaurant income statement. If you've ever reviewed a guide to restaurant P&L, you've seen how important it is to separate prime costs from the expenses that keep the whole operation functioning.
After you calculate the rate, compare it to net income, not just gross profit. That's where many owners realize they've been watching the wrong layer of the business. A clean net income review helps confirm whether overhead is the pressure point or whether the issue starts earlier in the cost structure.
Here's a short walkthrough for a service business.
Suppose a consulting firm totals all monthly overhead items, including admin payroll, rent, software, insurance, and utilities. Then it totals sales for that same month. It applies the formula: (Total Overhead Costs ÷ Total Sales) × 100.
That final percentage tells you how much of each sales dollar goes to overhead before profit is left over. If the number is higher than you expected, you don't automatically slash expenses. First, ask whether pricing, utilization, staffing mix, or delivery model is causing the strain.
For readers who prefer a quick visual explanation, this short video lays out the core idea clearly.
What the percentage actually tells you
Owners often calculate the ratio and then stop. That wastes the insight.
Your overhead rate is not just an accounting output. It's a management signal. It tells you how much operational weight the business carries before it can produce real bottom-line return.
Use the result in three ways:
- Pricing decisions: If overhead is heavier than expected, the issue may be underpricing, not overspending.
- Capacity planning: Some overhead is already in place. That means additional volume can improve margin if direct costs stay controlled.
- Trend analysis: One month is a snapshot. Several months show whether your structure is improving or drifting.
A percentage by itself doesn't fix anything. What matters is whether you can explain why it changed.
That's the turning point between bookkeeping and financial management. Bookkeeping records overhead. Management uses it.
Allocating Overhead for True Profitability Insights
A single company-wide overhead rate is useful for a first pass. It is not enough for a business with different products, channels, departments, or project types.
Many owners get trapped. They calculate overhead cost correctly at the company level, then spread it mentally across everything as if every sale consumes support resources the same way. It doesn't.
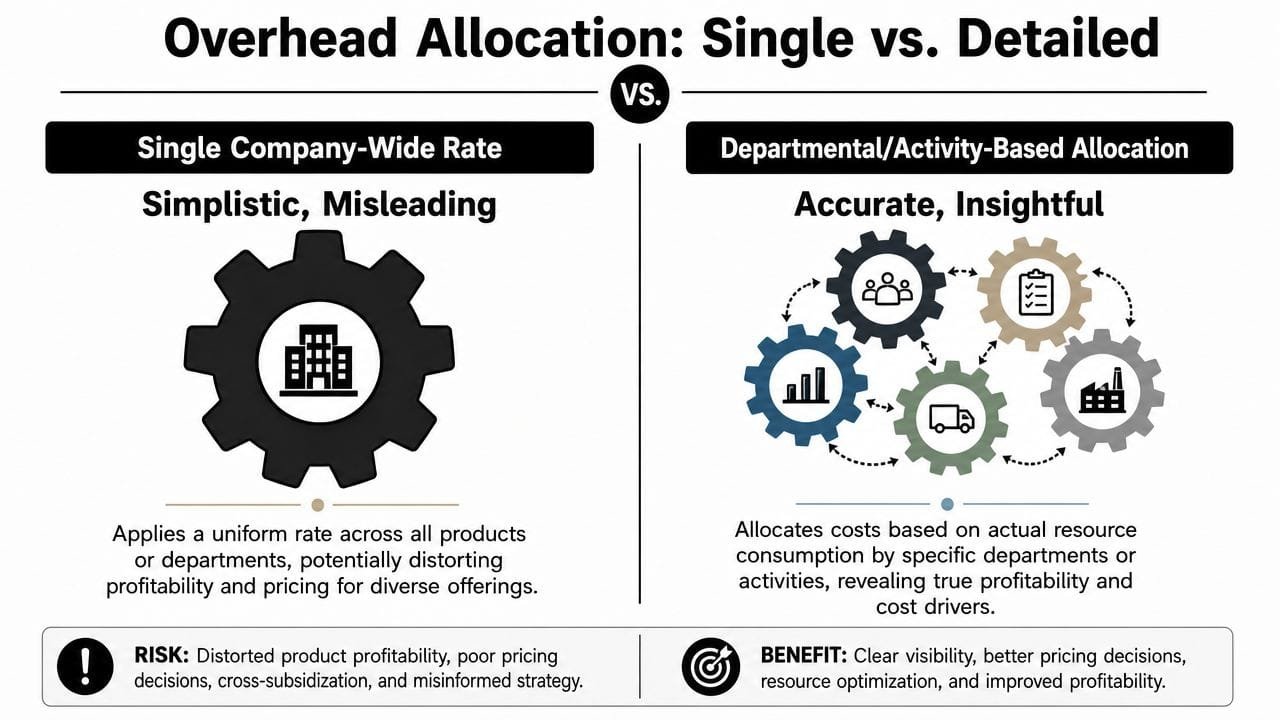
Why one company-wide rate can mislead you
A company-wide rate works like spreading the electric bill evenly across every room in a building, even though one room runs heavy equipment and another is mostly empty. It's simple. It's also blunt.
That matters because some offerings chew through labor supervision, machine time, floor space, warehouse handling, or project management support much more heavily than others. If you give every product the same overhead burden, low-support products can look worse than they are, and high-support products can look better than they are.
Pricing errors often begin here. A business thinks it has a margin problem in general when it really has a product mix problem.
If one product takes twice the attention, paperwork, handling, or machine use, it shouldn't carry the same overhead burden as the easy one.
Choosing the right allocation base
The right allocation base depends on what drives the overhead.
Use these as practical rules of thumb:
- Direct labor hours: Best when human effort drives delivery, such as consulting, contracting, repair work, or skilled trades.
- Machine hours: Best when equipment time drives cost, such as fabrication, machining, or production lines.
- Square footage: Best when departments use physical space very differently, such as retail, warehousing, kitchens, and mixed-use facilities.
- Units produced or handled: Useful when support effort tracks closely with throughput.
The manufacturing example is the clearest illustration. The Manufacturing Overhead Rate is Total Estimated Overhead Costs ÷ Total Estimated Allocation Base, according to ASC Software's manufacturing overhead guide. In the example provided there, a factory with $200,000 in estimated overhead and 10,000 direct labor hours has an overhead rate of $20 per labor hour. A product that requires 5 labor hours absorbs $100 of overhead.
That example matters beyond manufacturing. The principle is universal. Choose a base that reflects actual consumption, then apply the rate where the work happens.
Here's how to think about it in plain language:
| Business situation | Better allocation base | Why it works |
|---|---|---|
| Service firm with billable teams | Direct labor hours | Labor drives supervision and support burden |
| Factory with production equipment | Machine hours or labor hours | Production overhead follows machine or labor use |
| Restaurant with kitchen, dining, and storage areas | Square footage | Shared occupancy costs don't affect each area equally |
| Contractor managing multiple jobs | Labor hours or material cost base | Corporate support should follow project activity, not guesswork |
One caution matters. Precision has a cost. If you create ten different allocation models and nobody maintains them, the system collapses. Use enough detail to improve decisions, not so much detail that your team stops trusting the numbers.
The best allocation model is the one your finance team can explain, update, and defend.
Real-World Examples Restaurant Retail and Construction
A business can look busy, booked, and growing while one product line or one type of job absorbs more overhead than the owner realizes. I see this often. Revenue climbs, the bank balance feels tight, and the owner assumes labor or materials are the problem when the actual issue is shared cost sitting in the wrong place.
That is why real-world allocation matters. The goal is not a cleaner spreadsheet. The goal is to see which menu items, sales channels, and projects earn enough to support growth and stand up to lender scrutiny.
Restaurant space and support costs
A restaurant usually starts with one monthly overhead number that includes rent, utilities, insurance, software, management pay, and cleaning. That total is useful for budgeting, but it is too blunt for pricing and menu decisions.
A better model separates costs by how the operation consumes them. Rent and certain facility costs often fit square footage. The kitchen, dining room, bar, storage area, and office do not place the same burden on the business. If the kitchen takes a large share of the space and drives prep-heavy service, it should carry more of those occupancy costs.
That changes decisions quickly. A dish can show a healthy food cost percentage and still produce weak profit after you assign the extra prep space, refrigeration, storage, and management attention it consumes.
Restaurants that grow to a second location usually learn this the hard way. A menu built on blended overhead can look profitable on paper and still leave the operator short on cash.
Retail channel distortion
Retailers run into a different version of the same problem. A store owner may know total overhead with reasonable accuracy, but product and channel profitability often get blurred together. E-commerce orders can require more picking, packing, shipping support, customer service time, and return handling. Store sales usually carry more occupancy and front-of-house staffing cost.
If both channels absorb overhead through one blended rate, margins get distorted fast. The online catalog may look stronger than it is. The physical store may appear weaker than it is. Or the reverse.
The practical fix is to break overhead into buckets that reflect what drives the cost. Warehouse support can follow order volume or units handled. Store occupancy can stay with in-store sales. Return processing can follow the channel generating the returns. Marketplace fees and platform support should stay attached to the channel that caused them.
That gives owners a clearer answer to the question that matters. Which products deserve more inventory, more marketing spend, and more working capital?
Construction bids and corporate overhead
Construction brings the highest pricing risk because overhead errors get baked directly into bids. If a contractor prices only labor, material, equipment, and visible job-site support, the estimate can win work and still lose money once office salaries, estimating time, compliance, accounting, and management oversight hit the P&L.
The cleanest approach is to separate two categories:
- Job-site overhead: Site supervision, temporary facilities, permits tied to the job, trailer costs, and project-specific support
- Corporate overhead: Office rent, executive time, accounting, estimating staff, software, HR, insurance administration, and shared back-office support
That split matters because job-site overhead belongs to a specific project, while corporate overhead needs a disciplined allocation method. For many contractors, labor hours or another activity driver tied to project effort works better than a flat percentage copied from last year.
Better costing improves both margin and financing options. A lender reviewing your numbers wants to see that gross profit is real, not inflated because head office costs were left out of the estimate. Clean overhead allocation makes backlog quality easier to defend.
For field trades, tools like Exayard plumbing estimating software can speed up takeoffs and bid preparation, but the estimate is only as good as the overhead logic behind it. Fast bids help only if corporate support costs are built in with discipline.
Common Pitfalls and Using Overhead Data for Growth
A business can post solid sales, stay busy, and still feel cash pressure every month. In many cases, the problem sits inside overhead. The company is profitable on paper, but the costing model spreads shared expenses too loosely, too evenly, or not often enough.
That mistake shows up in three places fast. Prices drift too low. Strong products carry weak ones. Lenders start asking harder questions about margins, forecasts, and debt coverage because the numbers do not fully explain how the business runs.
Mistakes that weaken margins
The most expensive overhead problems usually come from classification and allocation discipline, not arithmetic. Analysts at Workday note that cost misallocation is a common source of distorted profitability, and they also point out that acceptable overhead levels vary widely by company size and operating model. That matters because there is no single "good" overhead percentage. A service firm, retailer, and contractor can all be healthy with very different cost structures.
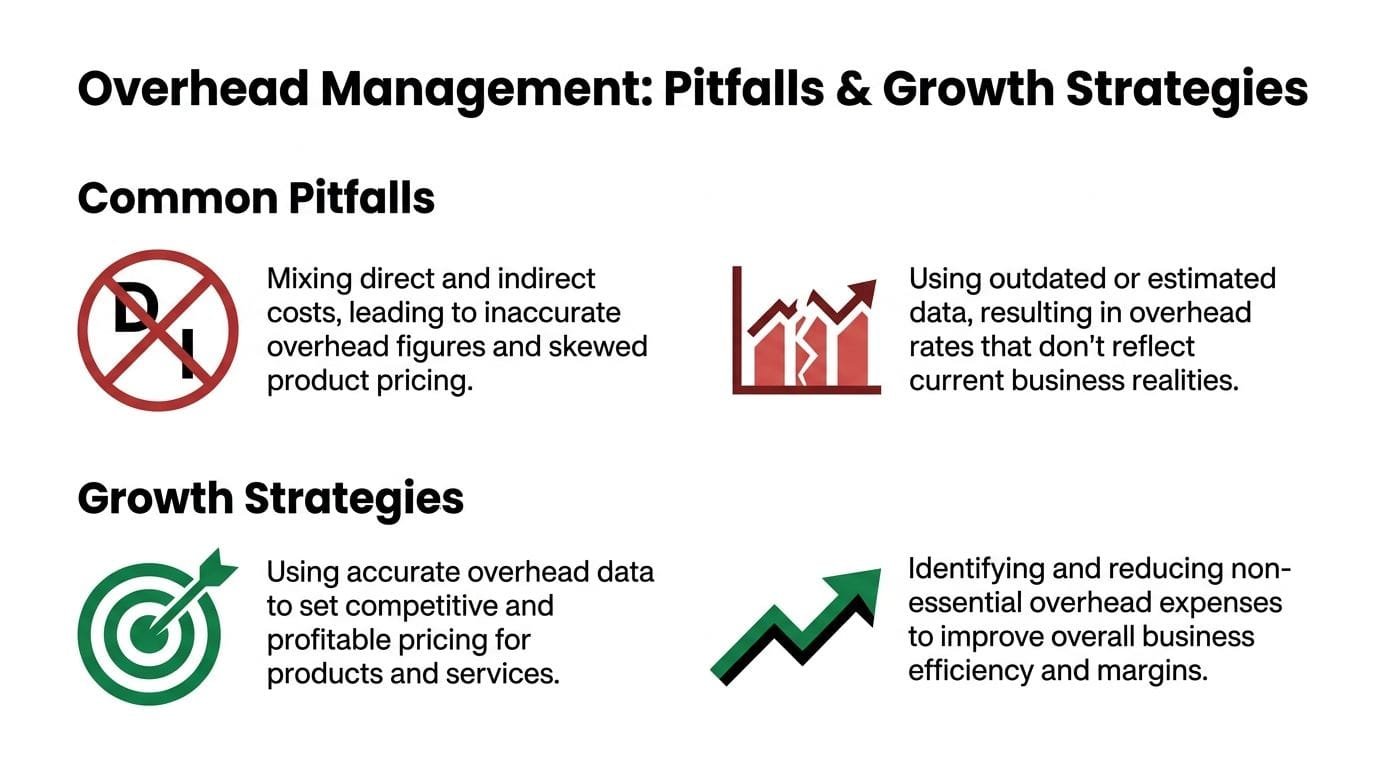
Watch for these trouble spots:
- Mixed cost buckets: Direct labor, freight, or job-specific support gets parked in overhead, which inflates the rate and muddies job or product margins.
- Flat allocations across unlike work: A simple percentage spread across every product line may be easy to maintain, but it often hides which customers, channels, or projects consume the most support.
- Stale drivers: Rent, software, admin payroll, and compliance costs may stay in the same account codes while the business changes underneath them. New locations, more managers, ecommerce growth, or longer project cycles can all make last year's allocation base a poor fit.
- Treating overhead as fixed when part of it moves: Some support costs rise with volume, complexity, or headcount. If the forecast treats all overhead as static, margins can look stronger than they really are.
- Using overhead only for reporting: If overhead data lives only in the monthly financials, it does not help with quoting, product mix decisions, or capacity planning.
Overhead works like the plumbing behind a building wall. You do not see it in the finished room, but if it is routed badly, every fixture gives you trouble.
Why lenders care about your overhead discipline
A lender is not just reviewing revenue. They are testing whether your earnings can hold up under normal strain, including payroll growth, seasonality, slower collections, or a new debt payment.
Clean overhead allocation makes that review easier. If you can show which products, jobs, or locations carry more administrative load, your profitability story gets more credible. If you cannot, reported gross profit can look overstated, and that raises concerns about repayment capacity.
Use your overhead data in ways that improve decisions, not just reports:
- Adjust pricing with precision: Raise prices where service intensity, customization, or support burden is higher.
- Trim weak work instead of cutting broadly: Sometimes the right move is dropping a low-margin line or customer segment that soaks up management time.
- Build better forecasts: Separate overhead that stays put from overhead that rises with growth, staffing, or complexity.
- Support loan conversations: Clear margin logic helps lenders see that cash flow is based on disciplined costing, not optimistic assumptions.
- Plan expansion with fewer surprises: New space, new staff, and new equipment all change the overhead load. Modeling that early protects growth from becoming expensive growth.
This is the point many owners miss. Overhead is not just a compliance exercise for the accountant. It is a decision tool for scaling.
If you are preparing for expansion, equipment purchases, a working capital gap, or a refinance, clean financials matter. Business Loan Warrior helps small businesses explore funding options with a no-fee application and a faster path to customized financing. When you can explain your true overhead by product, project, or location, you walk into that process with stronger numbers and a stronger case.