
You're staring at a small business income statement that says the month looked profitable, but the bank balance tells a different story. Payroll is due, a vendor wants payment, and your accountant is asking why the numbers look fine on paper while cash feels tight in real life. That tension is exactly why owners need more than a glance at profit, they need to know how lenders read the statement, how margins move, and which line items signal trouble before it hits the checking account.
A good P&L, or profit-and-loss statement, answers the question lenders care about first, is the business making money. It shows revenue, expenses, and the final net income for a defined period, usually monthly, quarterly, or annually, and it's the clearest way to compare performance over time. If you've ever wanted a sharper read on management reporting, a useful companion is management accounts explained, because it frames how internal reporting turns raw accounting into decisions.
The value isn't in bookkeeping for its own sake. It's in seeing where gross margin is getting squeezed, whether overhead is scaling too fast, and whether a business can support debt, payroll, rent, and taxes without guesswork. For owners who want a practical reminder that bank balance alone isn't the whole story, this guide on why a bank account isn't enough for smart financing moves is a useful counterpart to the numbers on the page.
Table of Contents
- Why Your Income Statement Tells a Different Story Than Your Bank Account
- Breaking Down Every Line Item on a Small Business Income Statement
- How to Prepare Your Income Statement Step by Step
- Reading Between the Lines with Common-Size and Trend Analysis
- The Profitability Ratios Lenders Scrutinize Before Approving Your Loan
- Why Profitable Businesses Still Run Out of Cash
- Turning Your Income Statement into a Decision-Making Tool
Why Your Income Statement Tells a Different Story Than Your Bank Account
A café owner opens the accounting software and sees a clean profit for the month. Then she checks the bank account and finds barely enough to cover rent and payroll. That's not a contradiction, it's a timing issue, and it's one of the most common places owners get tripped up when reading a small business income statement.
The income statement measures economic performance over a period, not the cash sitting in the account on a specific day. Revenue is matched against the expenses required to earn it, and the result is net income, the bottom line after all expenses are subtracted. That's why lenders, owners, and advisors use it to judge whether the business model is working, not just whether last week's deposits looked strong. The standard relationship is simple, revenue − expenses = net income, but the decisions it supports are anything but simple. In major markets such as the U.S. and Canada, this is foundational because it answers the core question, “Is the business making money?” according to BDC's income statement glossary.
Practical rule: if the bank balance and the P&L disagree, check timing first, collections second, and spending third.
That's why management reporting matters. A solid P&L gives owners a clean read on revenue, COGS, gross profit, operating expenses, and net income, which is the structure lenders expect to see when they evaluate operating health and debt capacity. The best operators don't wait for year-end to discover margin pressure. They review the statement regularly and use it to spot whether gross profit is strong enough to absorb overhead and still leave something at the bottom line.
The same logic is why this report shows up early in every financing conversation. Lenders want to know if the business can cover fixed costs such as rent, payroll, interest, and taxes, and the income statement is the fastest way to see that.
Breaking Down Every Line Item on a Small Business Income Statement
A useful income statement isn't a wall of numbers. It's a sequence that shows how sales turn into profit, and where the business leaks along the way. For a service company, that path is usually easy to follow once the statement is laid out cleanly.
Start with revenue and direct costs
Revenue is the total money earned from normal business operations. In a service business, that might be client retainers, project fees, or hourly billings. Direct costs come next, often called cost of goods sold or, in service businesses, cost of services. These are the expenses directly tied to delivering the work, such as contractor pay, subcontracted labor, or materials used on a job.
From there, gross profit shows what's left after those direct costs. That's the first real test of pricing power. If gross profit is thin, the problem usually sits in pricing, labor efficiency, or discounting, not in rent or software.
Then separate operating structure from financing burden
Operating expenses cover the overhead required to run the business, not deliver one specific job. Payroll for office staff, rent, marketing, insurance, software, and admin costs usually land here. This is the layer lenders watch closely because it reveals execution efficiency. If revenue grows but overhead grows faster, the business can look busy while becoming less resilient.
A small business owner using automation tools to sort expenses can reduce misclassification noise, and a guide to AI coworkers for expenses is helpful if expense categorization keeps getting messy in the books. Accurate categorization matters because a misposted cost can distort gross margin and make a healthy month look weak.
The final layers are EBITDA, interest expense, taxes, and net income. EBITDA strips out financing and tax effects to show operating earnings before those items, while interest expense shows the cost of debt and taxes show the government's share when applicable. Net income is the figure owners can use for reinvestment, reserves, or debt service.
| Sample Small Business Income Statement Structure | Amount | % of Revenue |
|---|---|---|
| Revenue | 100,000 | 100% |
| Cost of Goods Sold | 58,000 | 58% |
| Gross Profit | 42,000 | 42% |
| Operating Expenses | 30,000 | 30% |
| EBITDA | 12,000 | 12% |
| Interest Expense | 2,000 | 2% |
| Taxes | 1,000 | 1% |
| Net Income | 9,000 | 9% |
For a clean workflow from the bookkeeping side, the mechanics behind how to do journal entries help keep these lines from turning into a guessing game. The statement is only useful when each bucket reflects the actual economics of the business.
How to Prepare Your Income Statement Step by Step
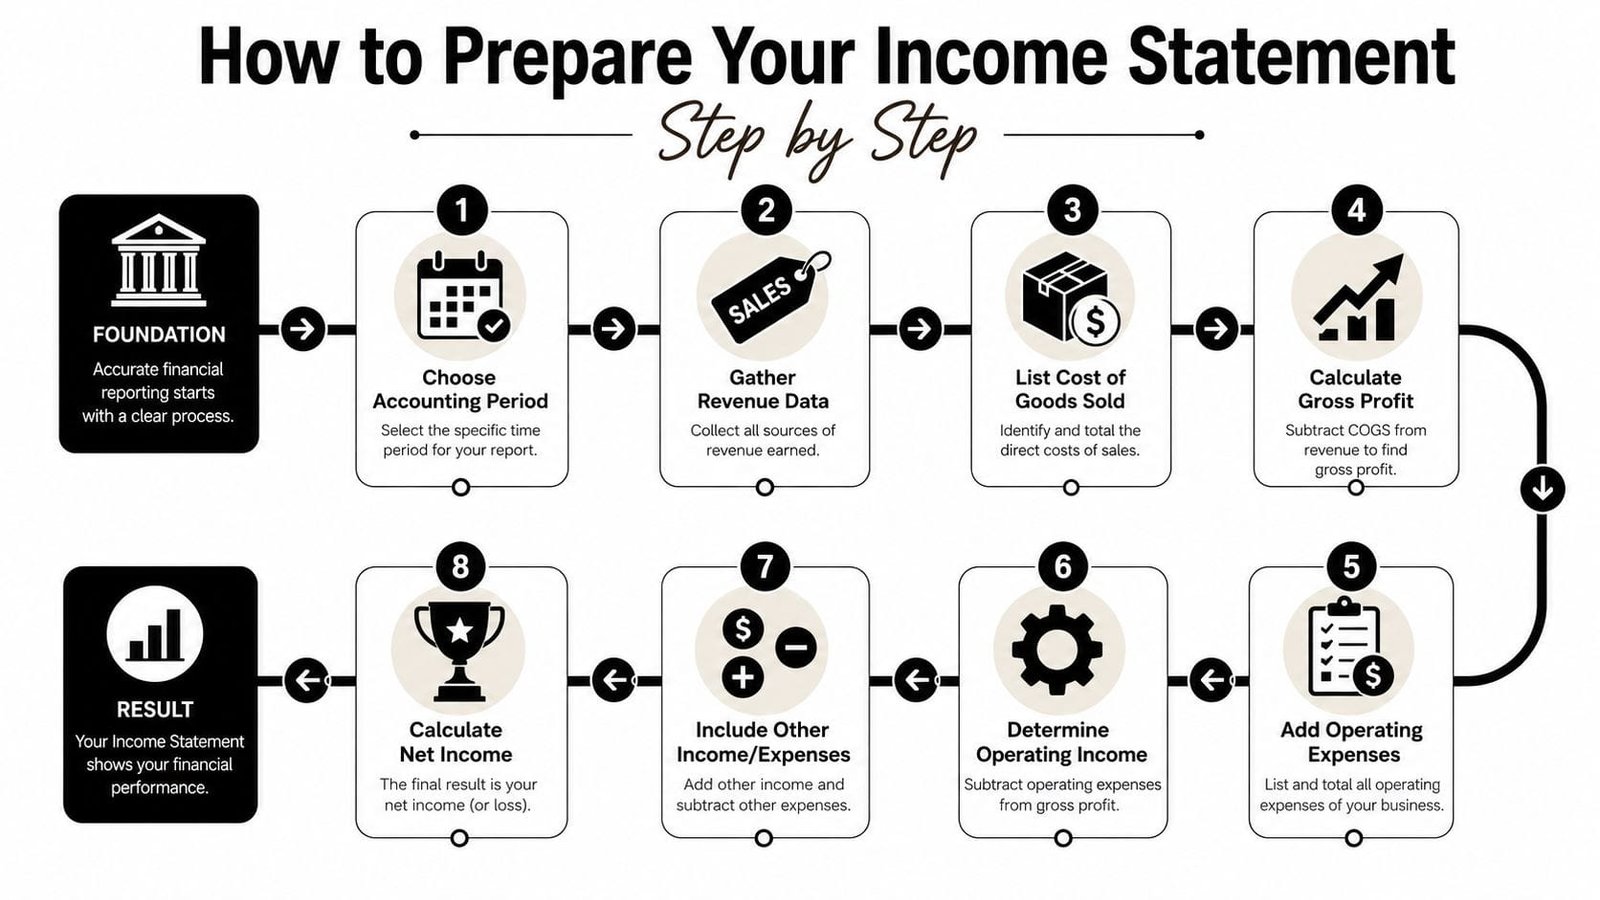
Preparation gets messy when owners mix cash movements, owner draws, and operating costs in one bucket. A clean statement starts with a clear reporting period, because monthly management numbers serve a different purpose than annual tax filings or quarterly lender reviews. Most owners need monthly statements for control, while lenders usually want a sharper look at recent trends and consistency.
Pull the numbers in the right order
Start with revenue from invoicing, point-of-sale, or billing software, then match direct costs to the work that created that revenue. Next, separate operating expenses from those direct costs, and make sure owner compensation is handled consistently rather than blended into random payroll or draws. If you use QuickBooks, Xero, Wave, or a spreadsheet, the software matters less than the discipline of the categories.
Clean reports come from clean input. If equipment purchases are shoved into ordinary expenses or payroll accruals are skipped, the margin lines stop meaning what you think they mean.
The biggest technical choice is cash-basis versus accrual-basis reporting. Cash basis follows money in and out, while accrual basis matches revenue and expenses to the period they belong to. Lenders usually prefer accrual because it gives them a clearer view of operating performance, especially when receivables, inventory, or delayed vendor payments are in play.
Reconcile before you trust the output
Once the statement is assembled, tie the totals back to bank activity, payroll records, and vendor invoices. If the numbers don't reconcile, the problem is often a missed entry, a duplicate charge, or a purchase that was coded in the wrong place. A common error is treating equipment as an ordinary expense, which can make one period look worse than it really is and distort comparisons.
A practical software stack can help, but only if the categories are used consistently. If you're comparing tools, accounting software for small businesses is a useful reference point because the best system is the one that keeps the monthly close simple enough to repeat. The close should be boring, repeatable, and fast enough that you'll do it every month.
Reading Between the Lines with Common-Size and Trend Analysis
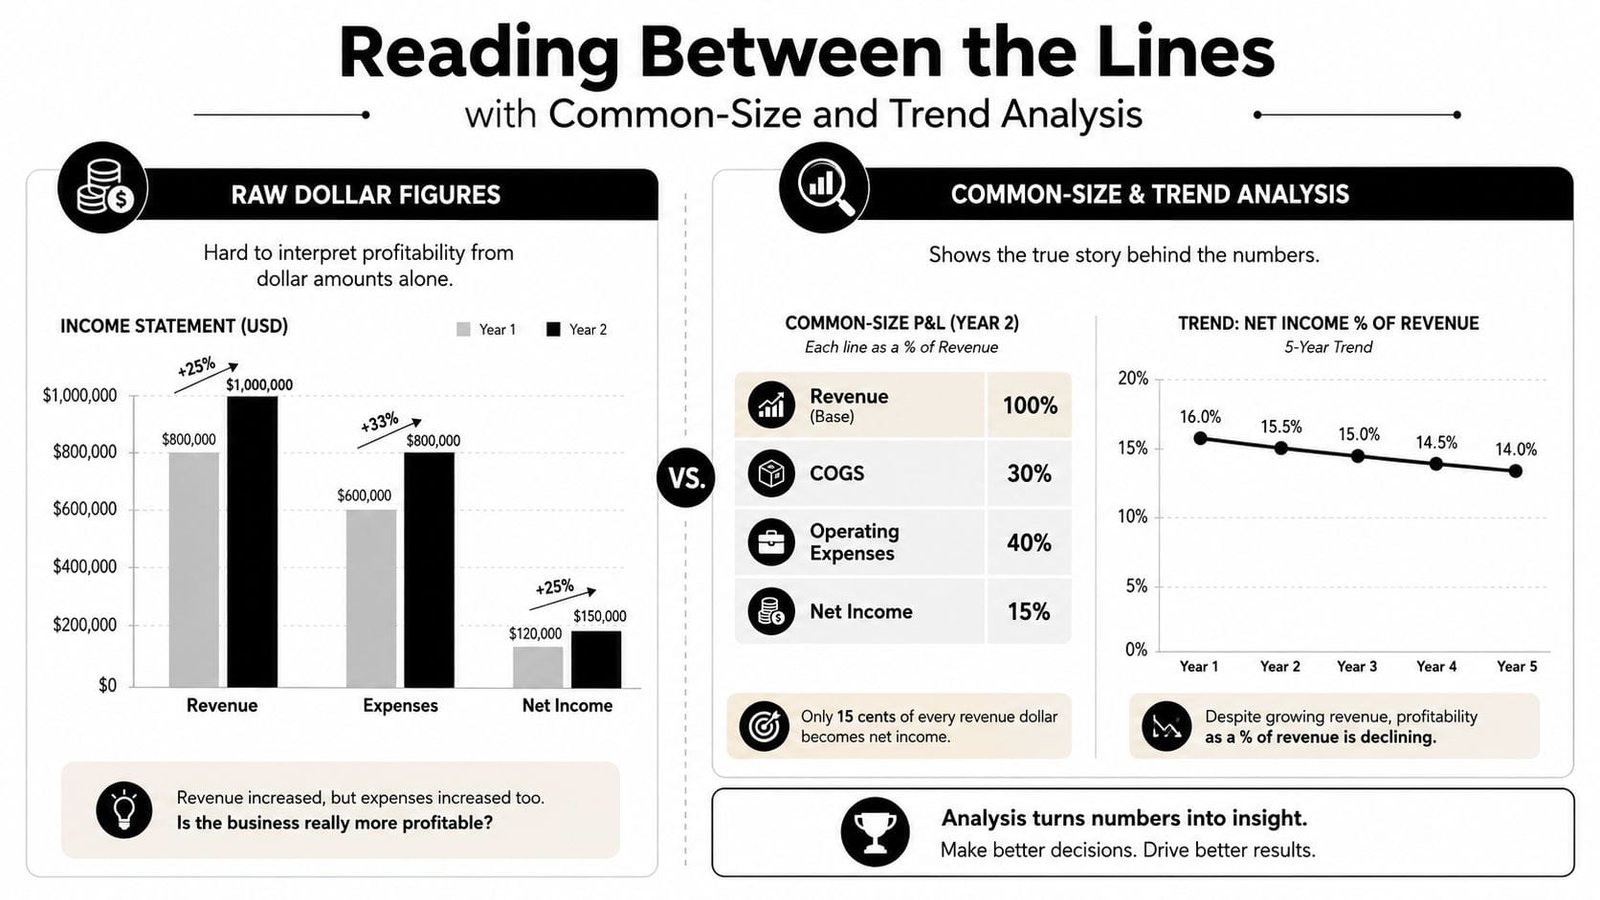
Raw dollars can hide the story. A business can post higher sales and still be moving in the wrong direction if expenses are rising faster, and lenders know how to spot that instantly. That's why a common-size statement matters, every line becomes a percentage of revenue, so different months can be compared on the same scale.
Vertical analysis exposes margin pressure
Vertical analysis is the simplest way to convert the income statement into a common-size format. If revenue is the baseline, then COGS, operating expenses, and net income are all expressed as shares of that revenue. That makes it easy to compare a month with lower sales against one with higher sales without getting fooled by bigger dollar amounts.
If COGS rises as a share of revenue, gross margin is under pressure. If operating expenses rise as a share of revenue, overhead is growing too quickly. Those shifts matter even when the final dollar profit still looks acceptable, because they show the underlying structure is weakening.
Horizontal analysis shows whether the move is temporary
Horizontal analysis compares line items across periods, usually year over year, by measuring change from one period to the next. The point is to separate a one-off spike from a structural shift. If marketing spend rises sharply while revenue barely moves, acquisition efficiency may be sliding. If payroll rises faster than sales for several months in a row, labor efficiency is probably deteriorating.
The useful habit is to track both views together, monthly. Vertical analysis tells you whether the business model is healthy on that date. Horizontal analysis tells you whether the pattern is improving or breaking down. That combination is what lets owners course-correct before a lender sees the same drift and decides the company is taking on too much risk.
A common-size view is especially helpful for businesses with uneven sales volumes. It lets you compare a strong month and a soft month without pretending they're the same size, which keeps the focus on margin behavior instead of raw top-line noise.
The Profitability Ratios Lenders Scrutinize Before Approving Your Loan
Lenders don't fund revenue alone. They fund repayment capacity, and repayment capacity shows up in margins, not just sales. A borrower with growing revenue but unstable margins can look riskier than a smaller business with steadier economics, because debt service depends on what's left after the bills are paid.
Gross margin tells the first part of the story
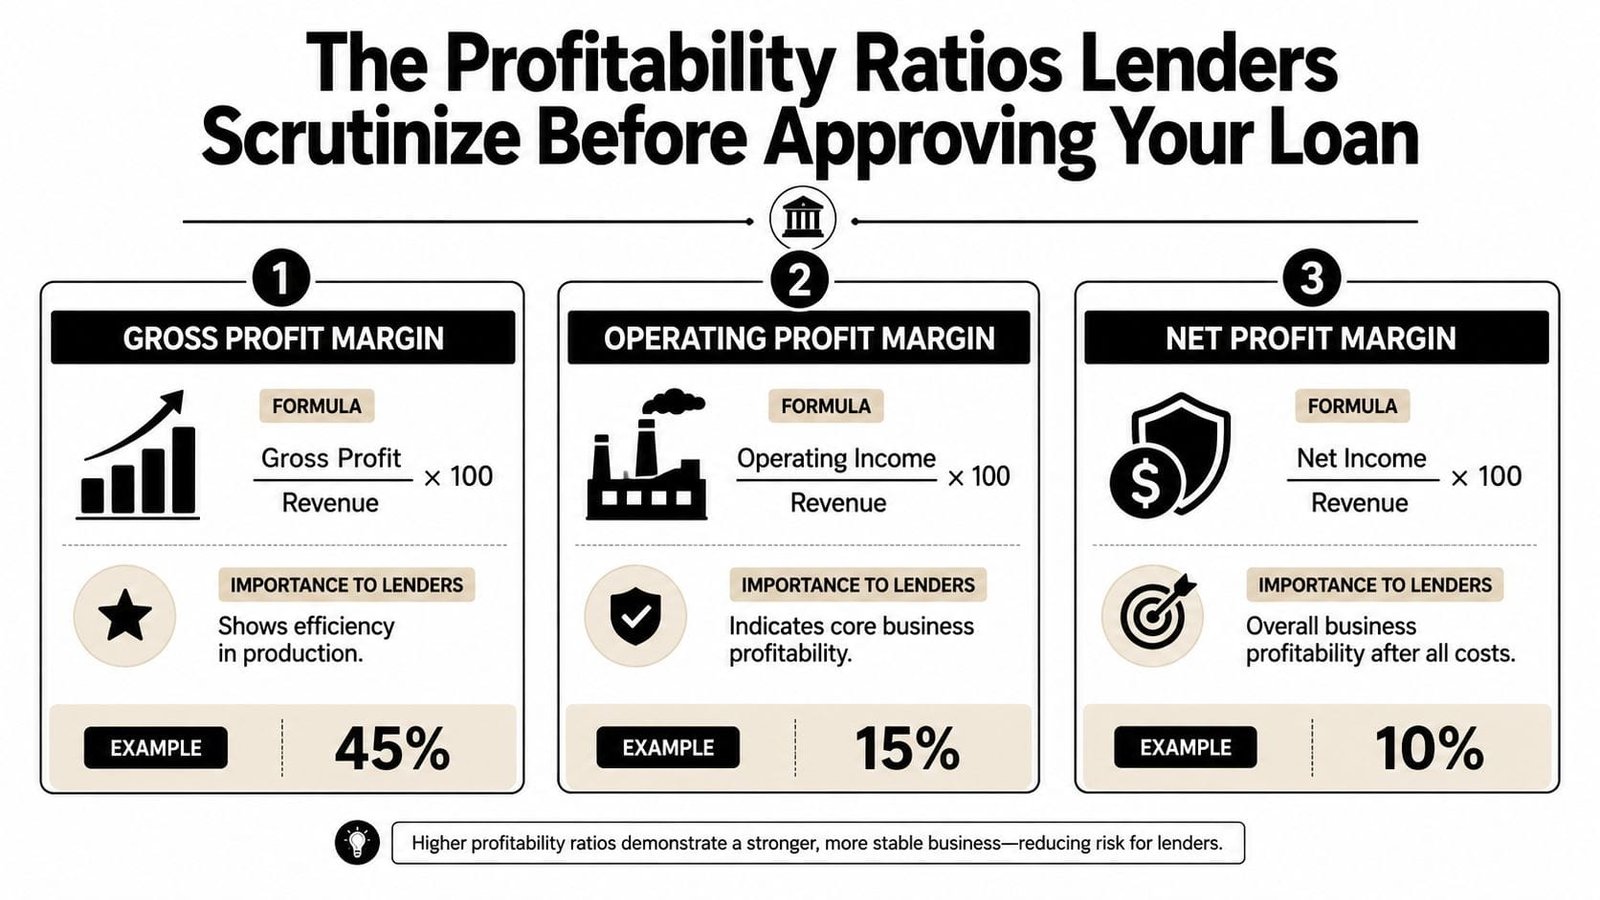
Gross margin is gross profit divided by revenue. It shows how efficiently the business produces or delivers what it sells. When gross margin slips, lenders usually look for input-cost inflation, discounting pressure, or labor inefficiency in direct costs.
Operating margin shows whether the overhead fits the business
Operating margin is operating income divided by revenue. It reveals whether the business can carry payroll, rent, software, marketing, and other overhead without letting expenses outrun sales. In labor-heavy businesses, this number often gets squeezed first, because execution problems usually show up in overhead before they show up in net income.
Net margin is the final underwriting lens
Net margin is net income divided by revenue. It shows what's left after interest and taxes, which makes it the broadest profitability signal. A strong top line doesn't rescue a weak bottom line if financing costs are eating too much of the profit pool.
The main reason lenders care about margin stability is how it affects a business's capacity to handle financial obligations. A business can often survive a tough month if margins stay predictable, but it can't absorb debt payments easily when every expense line is volatile. That's why a clean loan file should normalize owner compensation, remove one-time expenses that distort the picture, and present multiple months of margin history rather than a single flattering period.
When preparing for financing, the most valuable checklist is simple. Clean up categorization, show consistent margins, explain any unusual expenses, and make sure the income statement reflects the actual operating engine rather than accounting noise. That's the version underwriters trust.
Why Profitable Businesses Still Run Out of Cash
Profit is not cash, and that mistake has sunk more small businesses than bad sales ever did. The income statement can show a healthy bottom line while the checking account stays thin because accounting profit and spendable cash move on different clocks. Independent guidance on small business financial statements makes the same point, businesses need to review income statements with balance sheets and cash-flow reports together because profit alone leaves out timing, receivables, inventory, and debt service.
Timing gaps create the squeeze
A business may record revenue before it collects the money. It may also buy inventory or equipment before the matching revenue appears on the statement. Those gaps don't always hurt the income statement immediately, but they can drain cash fast.
Debt principal payments are another blind spot. The income statement reflects interest expense, but principal repayments reduce cash without showing up as an expense there. That's why a company can look profitable and still struggle to cover payroll or vendor bills.
The working-capital view matters more than the headline profit
The practical fix is to look at profit, cash, and working capital together. Tightening payment terms, building reserves during strong months, and matching debt schedules to the business's cash cycle all help narrow the gap between accounting profit and real liquidity. For owners who want a practical playbook for the cash side, how to improve cash flow is a useful complement to the income statement.
The point isn't to abandon profit reporting. It's to stop mistaking it for cash availability. Businesses that understand the difference make better hiring decisions, buy inventory more carefully, and borrow with less stress because they know where the cash is going.
Turning Your Income Statement into a Decision-Making Tool
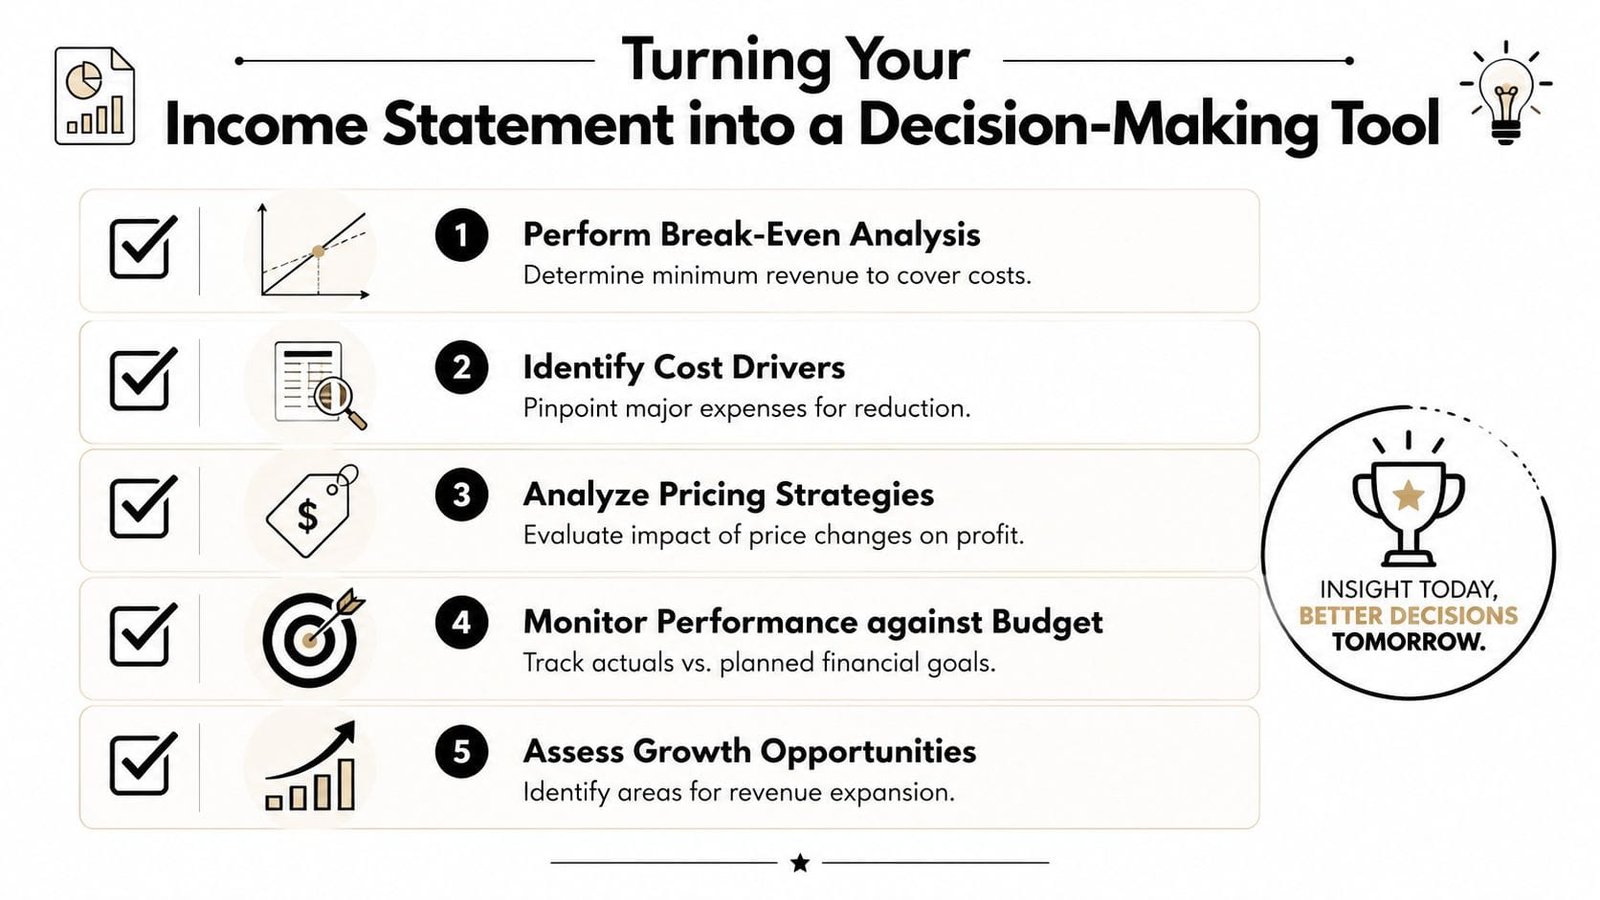
The best owners use the income statement before they need a lender, not after. They use it to test pricing, choose which jobs to chase, and decide whether growth is profitable or just busier. That shift matters because a statement that only satisfies the accountant leaves too much value on the table.
Use the statement to pressure-test decisions
Break-even analysis tells you the minimum revenue needed to cover fixed and variable costs. That's the fastest way to see whether a new hire, a price cut, or a new service line improves the business or just adds complexity. Product-level or job-level profitability tracking goes a step further by showing which work makes money and which work merely keeps the schedule full.
Scenario modeling is just as valuable. If you model a price increase or a cost reduction before implementing it, you can see the margin effect before the market does. That keeps you from making decisions based on intuition when the statement already has the answer.
Build a simple review habit and stick to it
A monthly review works best when it stays short and focused. Track revenue, gross margin, operating margin, net margin, and the few expense lines that move the most. Compare those numbers with your own historical baseline, not just broad industry averages, because your seasonality, customer mix, and cost structure are your real benchmark.
The goal isn't perfect accounting trivia. It's faster decisions, cleaner loan files, and fewer surprises when cash gets tight.
Weekly, watch cash movements and large new expenses. Monthly, review the full income statement and the balance sheet together. Quarterly, step back and look for margin drift, cost creep, and any line item that keeps pulling away from the pattern.
A good small business income statement isn't just a record of what happened. It's a tool for deciding what happens next, and that's the version lenders trust most.
If you want help turning your numbers into funding readiness, visit Business Loan Warrior to explore lending options and practical guidance built for owners who need to read their financials with confidence. Business Loan Warrior helps small businesses connect the income statement to real financing decisions, so you can pursue capital with cleaner books and a clearer case.