
Your profit and loss statement says you made money last month. Your bank account says you can't cover the loan payment on Friday. That's not a bookkeeping error. It's the gap cash flow statement analysis is built to explain, because invoices you've sent but haven't collected count as profit and count for nothing at the bank. This statement shows whether your operations generate cash, or whether you're borrowing to look busy.
Table of Contents
- What Each Section of the Statement Tells You
- How to Analyze a Cash Flow Statement in Five Steps
- Operating Cash Flow vs Free Cash Flow
- Ratios That Show Whether Cash Covers Debt
- Trend Checks and Red Flags to Catch Early
- A Small Contractor's Three-Year Cash Walkthrough
- Confirm Your Cash Position Before You Borrow
What Each Section of the Statement Tells You
A profitable contractor misses a payment because customers paid 60 days late while payroll came out every week. The income statement recorded the jobs. Only the cash flow statement recorded the waiting.
Since FASB Statement No. 95, issued in November 1987 and effective in 1988, every U.S. statement sorts cash into operating, investing, and financing activities. Before that, companies could emphasize working capital, cash, or other measures, so you couldn't compare one borrower to another on the same lines. The standardized split lets a lender separate recurring internally generated liquidity from one-time borrowing or asset sales.
What Each Cash Flow Category Includes and Signals
| Activity | Typical items | Healthy signal | Warning sign |
|---|---|---|---|
| Operating | Customer receipts, supplier and payroll payments, interest, taxes | Positive, and close to or above net income over several years | Negative for multiple periods while profit is reported |
| Investing | Equipment purchases, property sales, acquisitions | Outflows roughly match maintenance spending | Large recurring outflows with no matching revenue growth |
| Financing | Loan draws, loan repayments, owner contributions, distributions | Repayments paid from operating cash | Positive net cash change driven only by new borrowing or owner injections |
A business funding itself from operations is a different credit risk from one borrowing to stay open, even if both end the year with more cash. Before you calculate anything, identify which section carries the company's cash. If financing is doing the carrying, the rest of your analysis is about how long that can continue.
How to Analyze a Cash Flow Statement in Five Steps
Run these steps in order. Skipping to ratios before you've reconciled the statement means you can calculate a precise answer from numbers that don't tie out.
The workflow below moves from reconciliation to a debt service test.
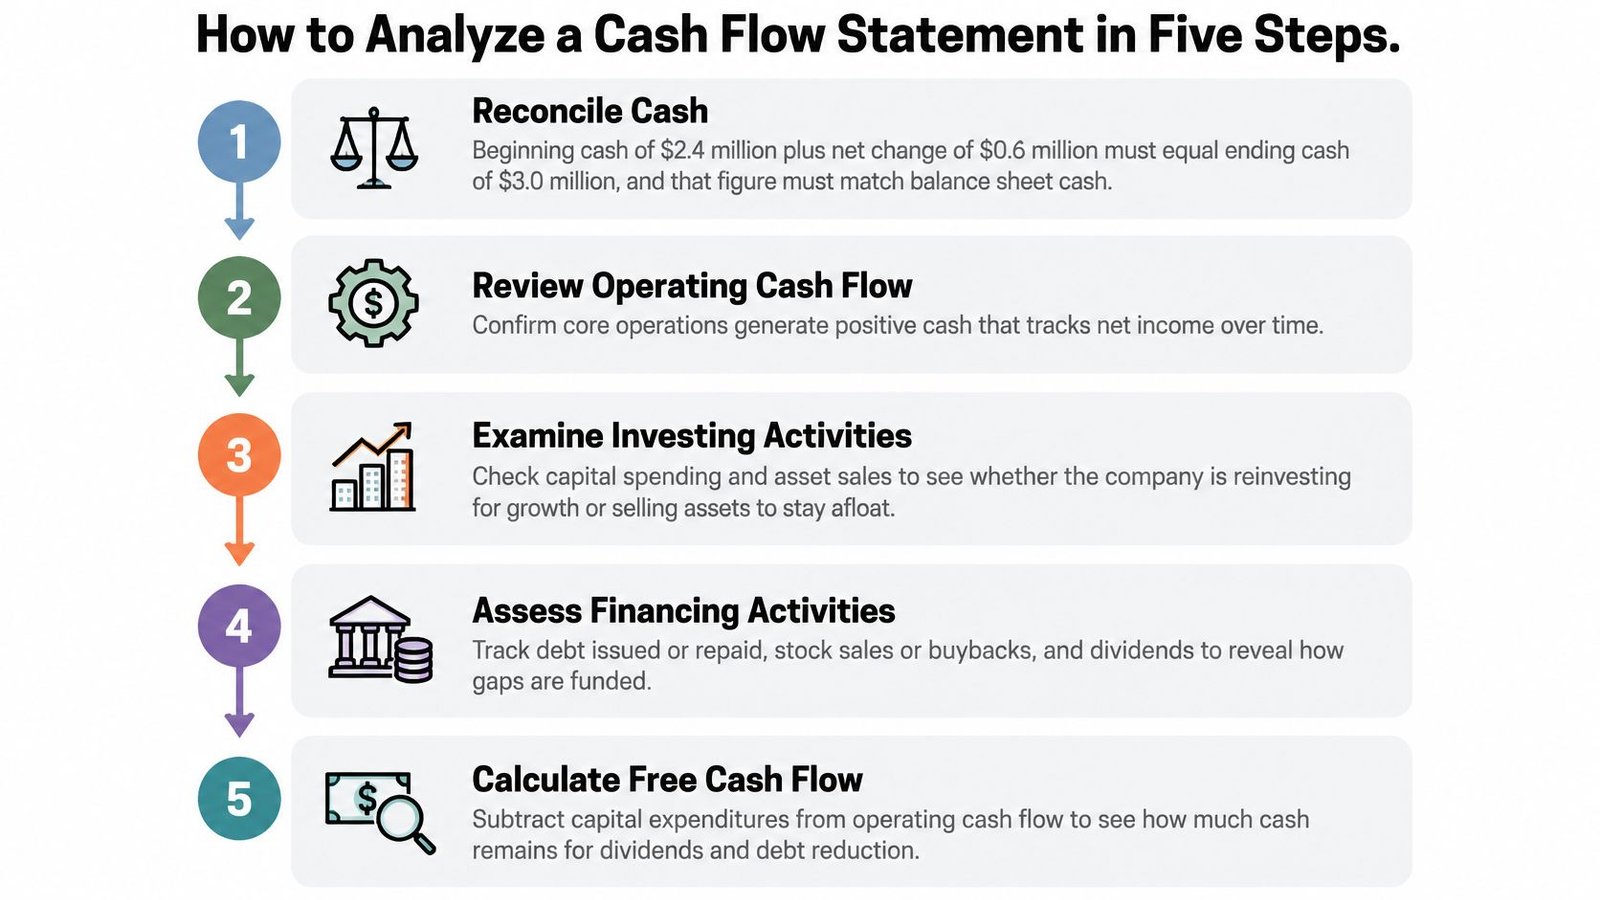
The Five Steps
- Reconcile cash first. Add beginning cash plus the net change in cash and confirm it equals ending cash, then match ending cash to the balance sheet cash line. A mismatch usually means restricted cash is mixed in or you're reading the wrong period, and either problem makes every later ratio unreliable.
- Classify and trend the three sections. Lay operating, investing, and financing flows side by side for three to five years, not one. One year tells you what happened. Several years tell you whether operating cash flow normally pays for equipment and debt, or whether financing fills the gap every year.
- Bridge net income to operating cash flow. Under the indirect method, test each adjustment, especially receivables, inventory, payables, and noncash items such as depreciation. This bridge shows whether profit became cash or got stuck in unpaid jobs and unsold stock. The SEC guidance on cash flow analysis frames this work as assessing future cash generation, ability to meet obligations, external financing needs, and differences between earnings and actual receipts or payments.
- Separate recurring cash from one-time cash. Pull out new borrowing, asset sales, and owner contributions, then look at what's left. A company can increase cash while operations consume cash if the increase comes from new debt or equity, so don't rely on a positive bottom line change alone.
- Stress-test debt service. Recalculate coverage assuming slower collections, margin compression, and higher working capital needs. Use cash available before discretionary distributions, not the best case. If coverage only works when customers pay on time and nothing breaks, it doesn't work.
Practical rule: Explain material changes in customer receipts, supplier payments, and financing drivers in plain words. Repeating line items back to yourself isn't analysis.
After step five you should have two things. First, one sentence on whether operating cash covers debt after normal spending. Second, a short list of lines that need a direct question for management, with the year and amount attached so the conversation stays specific.
Operating Cash Flow vs Free Cash Flow
Start with the arithmetic, using the indirect method most small businesses use. You begin with net income, add back depreciation and other noncash charges, then add or subtract changes in receivables, inventory, and payables.
Take a simple example. Net income is $90,000, depreciation is $40,000, and receivables increase by $20,000 because customers haven't paid yet. Operating cash flow is $90,000 plus $40,000 minus $20,000, which equals $110,000. The depreciation didn't use cash this year, so you add it back. The unpaid invoices did use cash you expected, so you subtract them.
Free cash flow is operating cash flow minus capital expenditures. If that same company spends $30,000 on a truck, free cash flow is $110,000 minus $30,000, or $80,000. That's what's actually available for debt repayment and owners after keeping the asset base working.
Why the Two Measures Diverge
Profit can look strong while cash lags because revenue is recorded before collection. Free cash flow can look weak in a year when you deliberately buy equipment that'll produce revenue for several years. Neither gap is automatically bad. The question is whether you can name the cause and whether it repeats.
Watch management-defined free cash flow closely. Some versions exclude lease payments or owner distributions that recur every month, which flatters the result. Recalculate it yourself from the statement rather than accepting a highlighted number in a loan package.
Treat operating cash flow as the measure of recurring cash from the business itself. Treat free cash flow as what remains for lenders and owners after you've paid to stay equipped.
If you're preparing the statement yourself, start from two balance sheets. Each change in receivables, inventory, payables, and accrued liabilities moves into the operating column, each change in fixed assets moves into investing, and each change in debt, leases, or owner equity moves into financing. That discipline forces every balance sheet movement to explain itself in cash terms.
Ratios That Show Whether Cash Covers Debt
Run the same five ratios every year so you can compare the business to its own history before you compare it to anyone else.
| Ratio | Formula | Rough benchmark | What it reveals |
|---|---|---|---|
| Operating cash flow margin | Operating cash flow ÷ revenue | Stable or rising year over year | Share of each sales dollar that becomes cash |
| Cash conversion | Operating cash flow ÷ net income | Above 1.0 across several years | Whether reported profit is turning into cash |
| Operating cash flow to current liabilities | Operating cash flow ÷ current liabilities | Above about 0.4 | Ability to cover short-term obligations from operations |
| Free cash flow | Operating cash flow – capital expenditures | Positive after maintenance spending | Cash left for debt repayment or owners |
| Debt service coverage ratio | Cash available for debt service ÷ annual principal and interest | 1.25x or higher | Whether cash covers scheduled loan payments |
The Two Ratios Lenders Check First
Cash conversion catches the profitable but broke pattern early. If net income rises while operating cash flow falls, profit is sitting in receivables or inventory instead of the bank. Introductory guidance on reading a cash flow statement supports comparing operating cash flow with net income and reviewing debt, capital expenditures, and trends, but you still need to separate sustainable cash from timing effects yourself.
The debt service coverage ratio decides whether new debt is supportable. Calculate it on post-maintenance cash flow, not total operating cash, because a company that skips equipment repairs looks healthier than it is for exactly one year. For a fuller explaination of lender thresholds, see what counts as a good debt service coverage ratio.
Positive operating cash flow alone isn't enough. Collecting a pile of overdue receivables or delaying supplier payments can lift one quarter while underlying conversion gets worse. Reconcile the ratio results with revenue growth, accounts receivable days, inventory, accounts payable days, taxes, owner distributions, and scheduled principal repayments. That's especially important for seasonal restaurants, retailers, and contractors growing faster than their working capital can support.
Benchmarks vary by industry, so treat the table as a screening tool, not a verdict. If coverage is under 1.25x, your next step is fixing cash flow, not adding debt. More borrowing on weak coverage just schedules a larger shortfall.
Trend Checks and Red Flags to Catch Early
A positive change in cash doesn't mean the business is healthy. It means cash went up, and it might have gone up because the owner borrowed against next year.
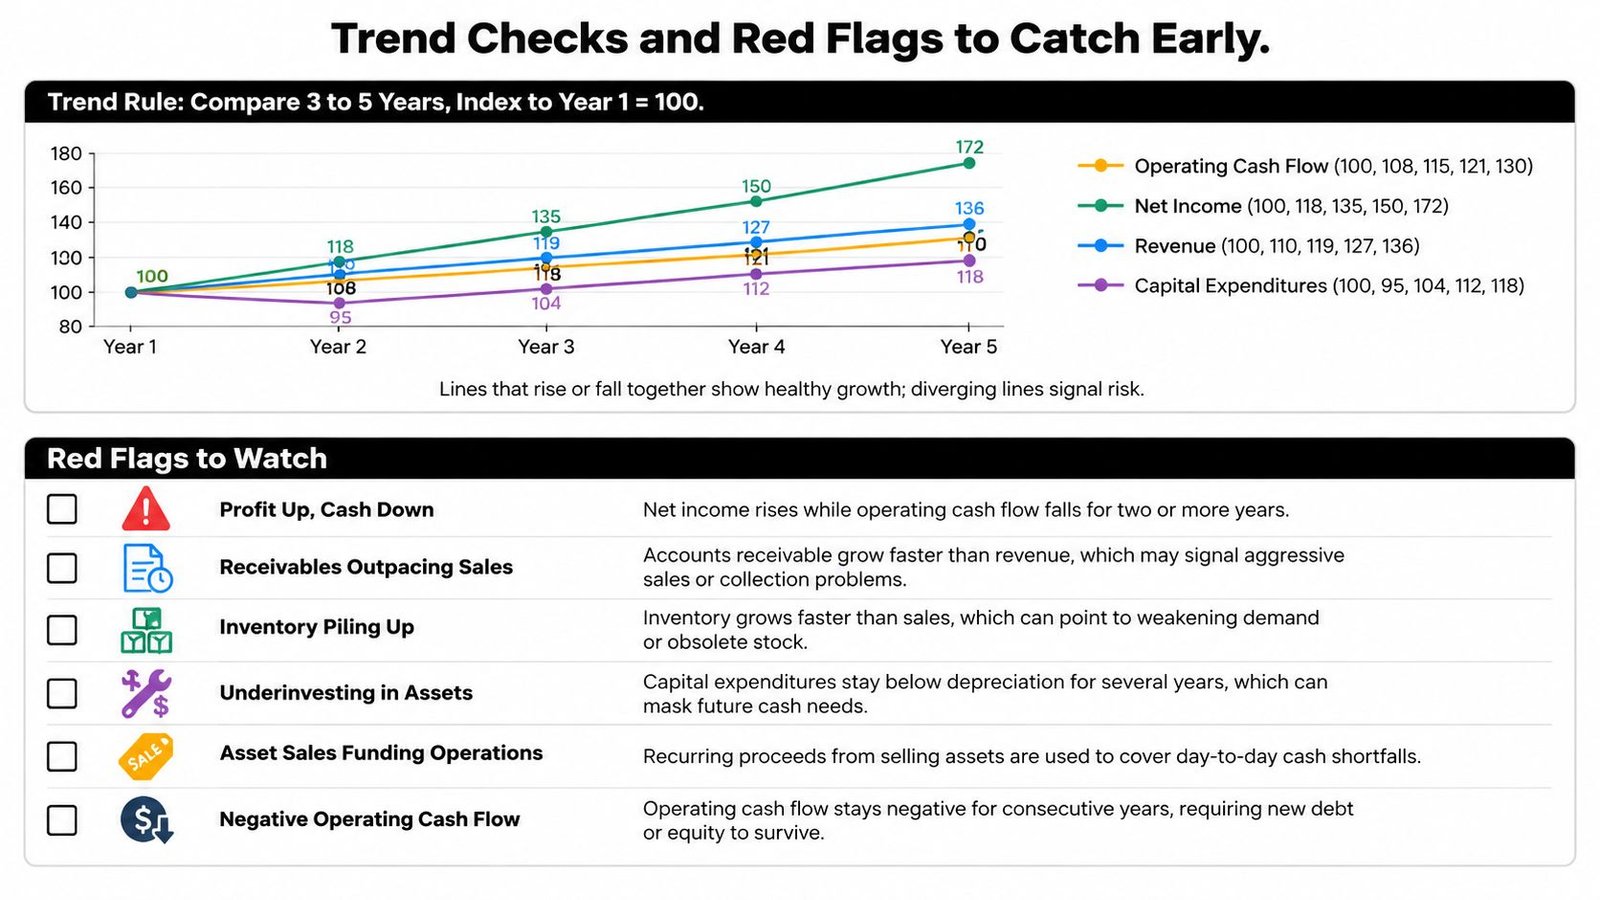
Compare three to five years and index each line to the first year so growth and decline are visible at a glance. The chart below shows how diverging lines expose trouble that a single year hides.
Red Flag Checklist
- Profit up, cash down: Net income rises while operating cash flow falls for two straight years.
- Receivables outpacing sales: Customers owe you more each year relative to revenue, which points to loose terms or collection problems.
- Financing carrying the year: The entire cash increase comes from new loans or owner injections.
- Leased equipment missing from investing: Vans or machinery acquired through finance leases don't appear as investing outflows.
- Distributions outside operations: Owner draws are recorded where they don't reduce the operating picture you review.
- Restricted cash counted as available: Cash pledged or held for a specific purpose is treated as spendable.
- Payables stretched: Suppliers are paid well beyond normal terms to keep cash positive at period end.
The 2025 IASB discussion of investor priorities for cash flow reporting flagged better disaggregation, reporting of non-cash transactions, transparency around measures not specified in standards, and more consistent classification. In plain terms, classification choices can make a company look more stable than it is.
Pair the statement with balance sheet movements in debt, leases, receivables, inventory, and fixed assets to find these items. Then look forward, because a clean history doesn't fund next quarter. Building a cash flow forecast that supports your loan strategy turns these trend checks into a forward test.
The walkthrough below shows several of these flags in a single set of statements.
A Small Contractor's Three-Year Cash Walkthrough
Follow a regional HVAC contractor whose revenue rises from $1.2 million in year one to $1.5 million in year three. On sales growth alone, a lender might say yes quickly. The cash walk tells a different story.
Year one is clearly healthy. Net income is $90,000, operating cash flow is $110,000, and after $30,000 of truck purchases, free cash flow is $80,000. Profit became cash, and cash covered equipment without new debt.
Year two is the trap. The company buys $90,000 of vans and finances them with a $90,000 equipment loan, so the net change in cash is only about +$5,000 and looks harmless. Underneath, receivables grow sharply as commercial customers stretch payments, operating cash flow falls to $5,000, and free cash flow drops to about -$85,000. Without the loan, the business would have lost $85,000 of cash in one year while reporting growth.
Three-Year Cash Flow Walkthrough for a $1.5 Million Contractor
| Line item | Year 1 | Year 2 | Year 3 | What it signals |
|---|---|---|---|---|
| Revenue | 1,200,000 | 1,350,000 | 1,500,000 | Sales growing each year |
| Net income | 90,000 | 95,000 | 80,000 | Profit falls in year three |
| Depreciation (noncash add-back) | 40,000 | 60,000 | 50,000 | Adds back to net income |
| Change in receivables and inventory | -20,000 | -150,000 | -120,000 | Cash tied up in unpaid jobs |
| Operating cash flow | 110,000 | 5,000 | 10,000 | Cash conversion collapses after year one |
| Capital expenditures | -30,000 | -90,000 | -25,000 | Trucks in year one, vans in year two |
| Free cash flow | 80,000 | -85,000 | -15,000 | Negative after equipment buying |
| New equipment loan | 0 | 90,000 | 0 | Hides the year-two cash outflow |
| Net change in cash | 80,000 | 5,000 | -15,000 | Only +5,000 despite the loan |
Read the table row by row. Revenue rises every year, so the top line gives no warning. The receivables row gives the warning, because cash is increasingly tied up in finished jobs nobody has paid for yet.
Year three confirms the pattern isn't a one-off. Net income falls to $80,000, yet operating cash flow is only $10,000, a cash conversion of about 0.13. For every dollar of reported profit, roughly thirteen cents arrived as operating cash. Free cash flow stays negative after modest equipment spending, which means the business isn't covering even maintenance-level investment from operations.
Now run step five. At $1.5 million in revenue, a 30-day slip in collections ties up about $123,000 of cash. That's more than twelve times the company's entire year-three operating cash flow. One slow-paying general contractor can erase a year of cash generation, and no new loan fixes that exposure. It just adds a payment to a business that already can't convert sales into cash on schedule.
Confirm Your Cash Position Before You Borrow
Use a clear yes-or-wait rule. If debt service coverage is at or above 1.25x on post-maintenance cash flow, and operating cash has tracked net income for three years, you have a reasonable basis to take on new debt. Bring the analysis that proves it.
If coverage is below that line, or your recent cash increase came only from borrowing or owner injections, fix the operating side first. Collect the oldest receivables, tighten payment terms on new jobs, and cut owner distributions until coverage recovers. The practical steps in how to improve cash flow are the right starting point before any application.
Apply the rule to the contractor. Year-three cash conversion of about 0.13 fails the test outright, so the next step is collections, not another loan. Adding debt service to $10,000 of operating cash flow doesn't create capacity. It consumes what's left.
Before any lender meeting, finish the five-step workflow and write down three questions for management about non-cash, leased, or reclassified items. A borrower who brings a completed analysis gets a faster, more credible review than one who brings only tax returns. Borrow when the test is passed, and wait when it isn't.
When your five-step analysis shows coverage at or above 1.25x on post-maintenance cash flow, Business Loan Warrior can help you check pre-approval through a single no-fee application without affecting your credit and compare working capital, equipment, and SBA options matched to your cash position. Bring your reconciled statement and your three management questions, and start the conversation from numbers a lender can trust.