

You're probably looking at two numbers that seem to fight each other.
Revenue is up, but payroll is up too. You added people to support sales, operations, service, or compliance, and now you're asking a hard question: are we becoming more efficient, or just bigger? If you're also thinking about a loan, a line of credit, or expansion financing, that question gets sharper fast.
A lot of owners in the $20M to $50M revenue range run into the same problem. Traditional staffing metrics give a partial picture. They count employees on payroll, but they often ignore the contractors, agencies, outsourced finance teams, and fractional specialists doing real work inside the business. That can make your efficiency look stronger than it really is.
Revenue per employee is still useful. It helps you connect top-line performance to staffing decisions. But if you use it without adjusting for outside labor, you can make bad hiring calls, misread profitability pressure, and walk into funding conversations with a distorted story.
Table of Contents
- Introduction to Revenue Per Employee
- Understanding Revenue Per Employee Concepts
- Calculating Revenue Per Employee with Examples
- Industry Benchmarks and Interpretation for SMBs
- Why Revenue Per Employee Matters for Operations and Lending
- Practical Strategies to Improve Revenue Per Employee
- Tracking Revenue Per Employee with Business Loan Warrior
- Conclusion and Next Steps
Introduction to Revenue Per Employee
A small business owner hires five people in a strong year. Sales needed support. Customer success was stretched. Finance needed cleaner reporting. On paper, the company looked healthier because revenue grew. Then year-end numbers came in, and profit didn't move the way expected.
That's where revenue per employee becomes useful. It asks a simple question: how much revenue does the business generate for each person on the team? Not as a judgment on individual employees, but as a way to understand whether the company's staffing model matches its revenue engine.
Why owners pay attention to this metric
This number helps with decisions that feel operational on the surface but are financial underneath:
- Hiring timing: Should you add headcount now or wait until revenue catches up?
- Team design: Is your growth being driven by the right mix of sales, service, operations, and admin roles?
- Funding readiness: Can you explain your labor efficiency clearly if a lender asks?
Where people get tripped up
Many owners assume a higher number always means a better business. It doesn't. A very low number can point to weak productivity or overstaffing. A very high number can mean you're running too lean, starving sales capacity, or leaning heavily on people who aren't on payroll.
Practical rule: Treat revenue per employee like a dashboard light, not a trophy. It tells you where to look next.
Used the right way, this metric helps you spot strain early, make cleaner staffing decisions, and prepare for financing conversations with more confidence.
Understanding Revenue Per Employee Concepts
The concept of revenue per employee is straightforward. You take total revenue for a period and divide it by the number of employees for that same period. Most companies use a trailing annual figure because it smooths out seasonality and one-off spikes.
That simplicity is why the metric is popular. It's easy to calculate, easy to compare over time, and easy to explain to a leadership team. The problem is that standard definitions usually count only payroll headcount.
The contractor blind spot
Small businesses often scale with a mixed workforce. They use contractors for marketing, software development, bookkeeping, recruiting, design, operations support, and fractional leadership. Those people influence revenue and delivery capacity, yet standard revenue per employee leaves them out.
That omission creates what I call the contractor blind spot.
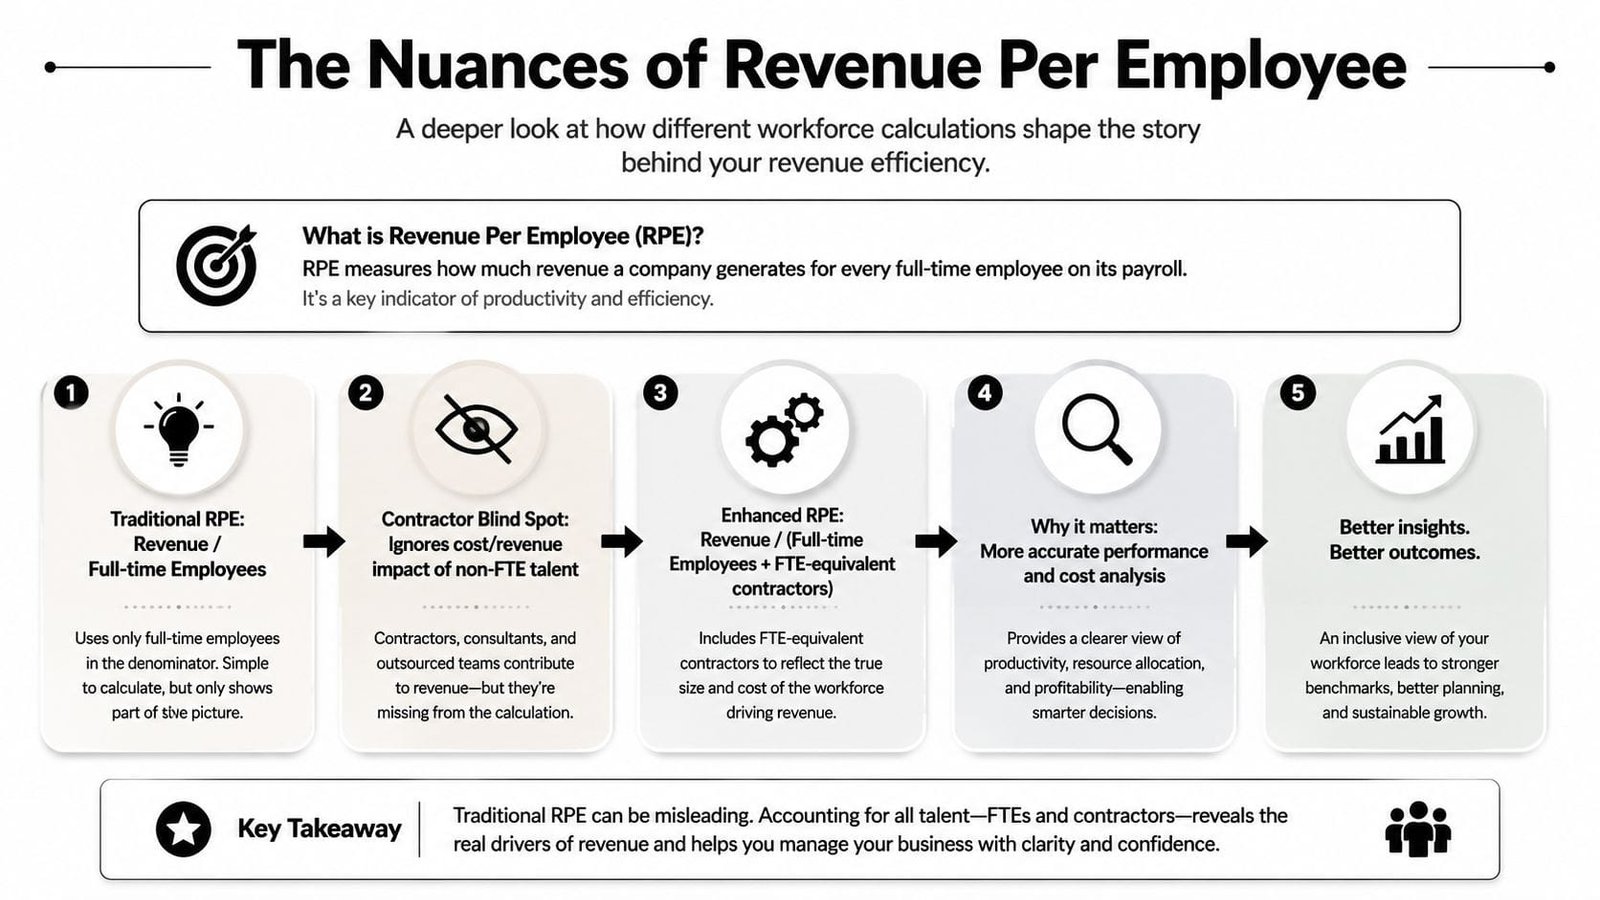
A verified example shows the distortion clearly. A business with $10M in revenue, 40 full-time staff, and 20 contractors appears to have $250k in revenue per employee using the standard formula, but the efficiency drops to $166k when contractor contribution is included through a fuller staffing count, as outlined in HiBob's explanation of the metric in practice at HiBob's revenue metric guide.
If you've ever compared your staffing costs with your top line and felt the math looked too flattering, this is often the reason.
A better lens for hybrid teams
For businesses that rely on both employees and outside talent, a better version is RPE+:
RPE+ = Revenue ÷ (Employees + contractor FTEs)
The key phrase is contractor FTEs. You don't just count every freelancer as one whole person. You estimate how much of a full-time workload they represent across the measurement period. That gives you a more honest denominator.
This matters most when your business has moved beyond a simple payroll structure. If your controller is fractional, your paid media team is outsourced, and your development work sits with a contracted partner, your reported efficiency may look better than your true financial structure.
Before you calculate anything, make sure you're using the right revenue figure. If your team mixes gross sales, net sales, and collected cash, start by reviewing the basics of gross revenue.
A clean metric starts with a clean definition. If labor is mixed, the denominator has to be mixed too.
Calculating Revenue Per Employee with Examples
Once you've defined revenue and headcount correctly, the math is simple.
The two formulas to use
Use the standard formula when your business relies mostly on full-time staff:
Revenue per employee = Revenue ÷ Employees
Use RPE+ when contractors carry a meaningful share of delivery, sales support, operations, or specialist work:
RPE+ = Revenue ÷ (Employees + contractor FTEs)
The reason for keeping both is practical. Standard RPE shows the common benchmark figure. RPE+ shows your real labor efficiency if outside talent is part of the machine.
Two worked examples
Start with a pure employee model.
A company generates $10M in revenue and has 40 employees. Standard revenue per employee is:
$10M ÷ 40 = $250k
Because there are no contractor FTEs in this example, RPE and RPE+ are the same.
Now compare that with a hybrid workforce.
A company generates $10M in revenue, has 40 employees, and uses 20 contractor FTEs. Standard RPE still shows:
$10M ÷ 40 = $250k
But RPE+ becomes:
$10M ÷ (40 + 20) = $166k
That's a very different story. The first number says, “We're highly efficient.” The second says, “We're generating that revenue with a larger labor footprint than payroll alone suggests.”
| Scenario | Revenue | Employees | Contractor FTEs | RPE | RPE+ |
|---|---|---|---|---|---|
| Pure FTE team | $10M | 40 | 0 | $250k | $250k |
| Hybrid workforce | $10M | 40 | 20 | $250k | $166k |
A simple way to estimate contractor FTEs
If contractor time is messy, don’t let that stop you. Use a reasonable internal estimate.
- List recurring contractors who contribute every month.
- Group them by function such as marketing, finance, IT, operations, or sales support.
- Estimate workload share relative to one full-time role over the period.
- Add those estimates together to create your contractor FTE count.
If your profit and loss statement is disorganized, clean that up before you calculate staffing efficiency. A sharper P&L management process makes this metric much easier to trust.
Industry Benchmarks and Interpretation for SMBs
A contractor-heavy agency and a contractor-light manufacturer can post the same revenue per employee and still operate in very different ways. That is where owners get tripped up. They compare one headline number to a broad average, then miss the labor hidden outside payroll.
Across industries, benchmark figures vary widely. HRBench’s summary shows a global average of about $350,000 per employee in 2024 and a broad U.S. average of $111,000 across more than 90 sectors, according to HRBench. Those numbers are useful as rough orientation, not as a target for every small business.
Why broad averages distort the picture
Revenue per employee works like miles per gallon. It helps, but only if you know whether you are measuring a compact car, a pickup truck, or a delivery van loaded with tools. Industry model matters first.
HRBench’s industry comparison shows how wide the spread can be. Entertainment software sits around $1.76 million per employee, real estate development around $1.42 million, and brokerage and investment banking around $1.3 million. Labor-heavy fields such as restaurants and general retail often sit below $35,000 per employee.
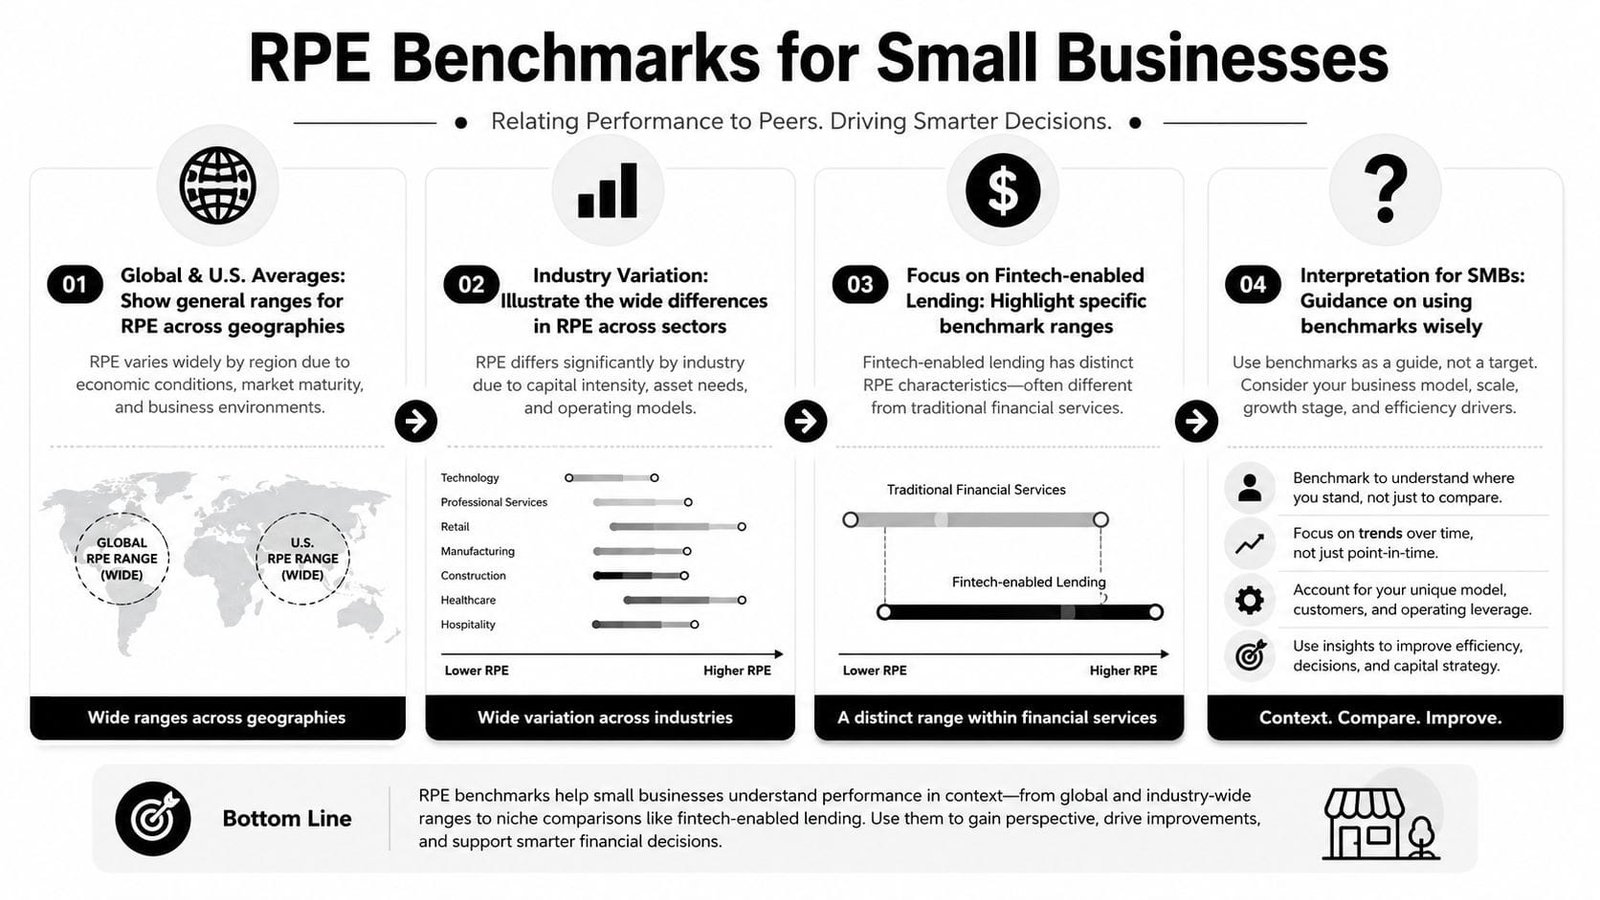
So a single target number does not help much. A restaurant owner, an insurance brokerage, and a SaaS firm are solving different staffing problems. Their company operations structure shapes what a healthy RPE should look like.
The SMB blind spot: standard RPE misses contractor labor
Small businesses often outsource before they hire. Bookkeeping, paid media, design, IT support, recruiting, and fractional leadership can all sit outside employee headcount. Standard RPE ignores that work, which can make a business look more efficient than it really is.
That is why RPE+ matters. If standard RPE is your dashboard speedometer, RPE+ is the version that also shows trailer weight. It gives you a fairer reading of labor efficiency when contractors carry a meaningful share of production.
Use a layered benchmark:
- Compare your number to businesses with a similar model and service mix.
- Check your own trend over time.
- Review RPE+ beside standard RPE if contractors meaningfully support delivery, sales, or operations.
For fintech-enabled lending platforms, a narrower benchmark can be more useful than a broad market average. Revenue per employee often falls between $200,000 and $500,000, and dropping below $200,000 within three years can point to staffing bloat relative to revenue growth.
How to interpret the number without forcing the wrong decision
A low result is not an automatic warning sign. You may be building capacity ahead of growth, carrying extra compliance work, or bringing work in-house that used to sit with vendors.
A high result is not automatically healthy either. It can mean the team is stretched, customer support is thin, or founders are delaying needed hires to keep the ratio looking strong. Teams that track labor efficiency alongside workflow visibility often get a clearer operating picture, especially when they are visualising KPIs with Dynamics 365.
The useful question is simple: does this benchmark fit your business model, your growth stage, and your real labor footprint, including contractors? If not, standard revenue per employee is only part of the story.
Why Revenue Per Employee Matters for Operations and Lending
Inside the business, revenue per employee helps leaders connect staffing decisions to financial output. Outside the business, lenders use it as one clue about operational discipline. They’re asking a simple question: does this company convert labor into revenue in a way that looks stable and scalable?
What lenders often see in the number
An extremely low figure can suggest weak execution, bloated staffing, or revenue that hasn’t caught up with hiring. An extremely high figure can create a different concern. The business may be under-investing in growth, running too lean, or depending on a few overextended people.
That’s one reason the “higher is always better” mindset causes trouble. A verified benchmark for enterprise SaaS companies under $100M in revenue places the ideal range at $120k to $168k, and the same analysis notes that very high RPE can signal under-investment in growth and even hurt loan eligibility, according to Indeed’s hiring metrics explainer.
The operational angle
This metric matters because staffing choices shape everything else:
- Sales coverage: Too few sellers and pipelines thin out.
- Service quality: Too few operators and customer issues pile up.
- Financial control: Too little back-office support and reporting weakens.
- Execution speed: Lean teams can look efficient right before they become a bottleneck.
If your leadership team tracks efficiency visually, it helps to see how other firms approach visualising KPIs with Dynamics 365 so you can spot staffing stress before it hits cash flow.
The strongest story for a lender isn’t “we squeezed every dollar out of a tiny team.” It’s “we staffed for disciplined growth and can show the math.”
A lot of this comes down to how you run the business day to day. Stronger operations in a company usually lead to a healthier efficiency profile than reactive hiring or across-the-board cuts.
Practical Strategies to Improve Revenue Per Employee
Improving revenue per employee doesn’t mean pushing people harder. It means removing waste, sharpening roles, and making sure labor goes where revenue moves.
Here’s a practical order of attack.
Fix process friction first
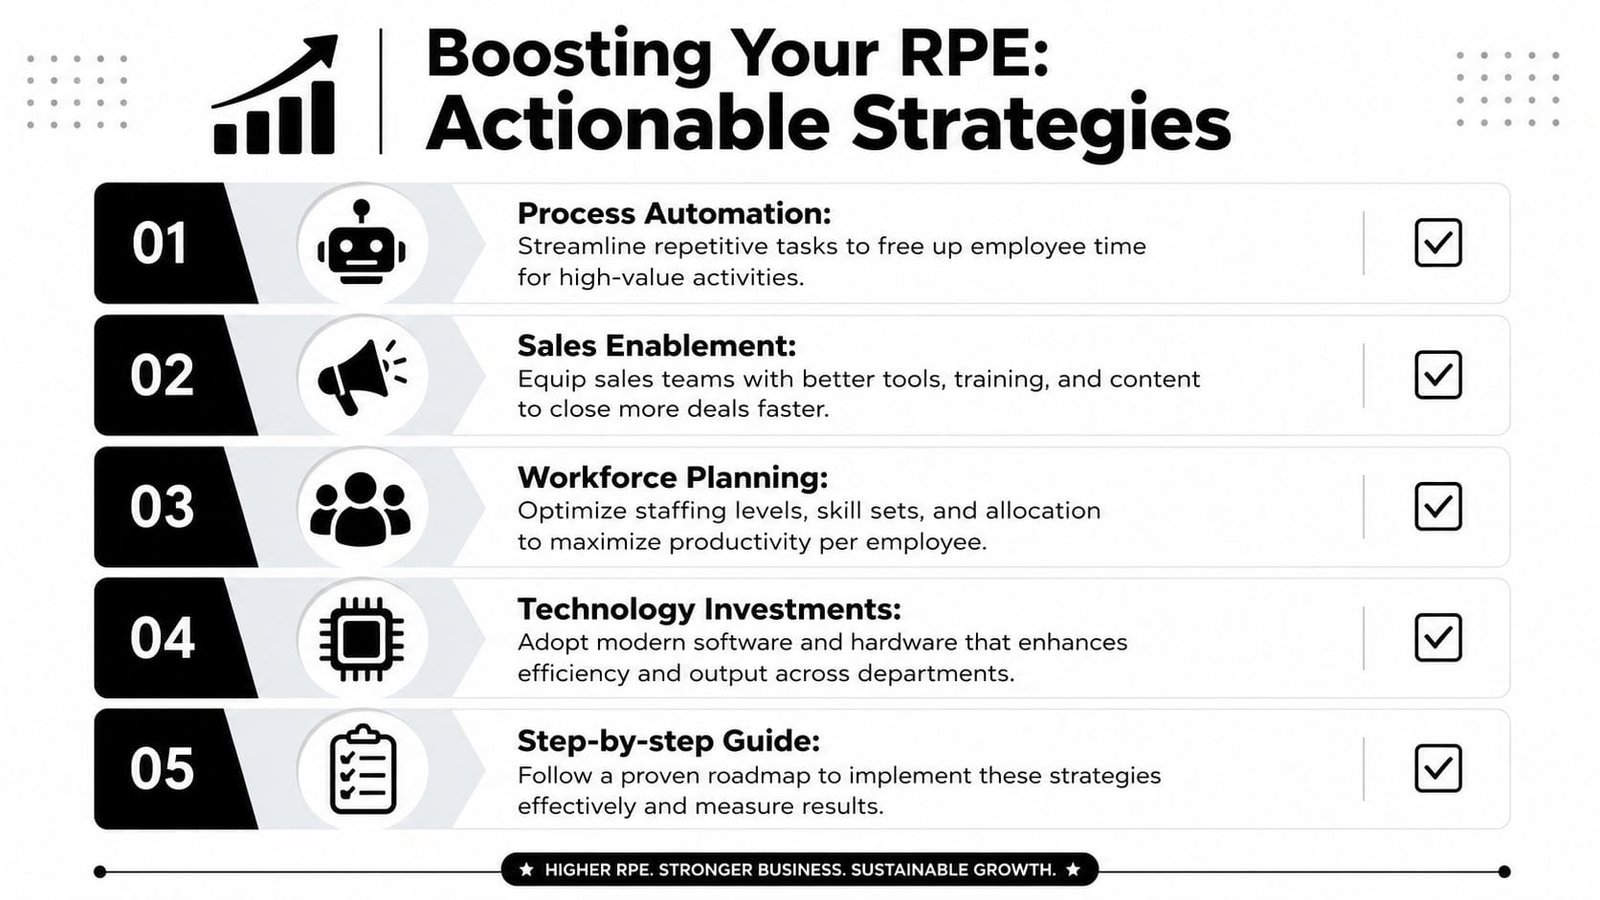
Before hiring or cutting, audit the repeatable work.
- Map repetitive tasks: Look at invoicing, scheduling, reporting, order handling, approvals, and customer follow-up.
- Automate routine handoffs: Use the tools you already pay for before buying new ones.
- Remove duplicate work: If sales, finance, and operations each maintain separate versions of the same data, fix that first.
A quick explainer can help your team think in practical terms about productivity and workflow:
Upgrade revenue capacity, not just cost control
Many owners try to improve the metric by freezing hiring. That can backfire if sales and customer expansion stall.
Try this checklist instead:
- Review role-to-revenue connection. Which roles directly create, protect, or expand revenue?
- Support sales execution. Better tools, cleaner handoffs, and stronger follow-up often improve output without adding headcount.
- Use contractors deliberately. Flexible talent is useful, but count it in RPE+ so you don’t fool yourself.
- Protect retention. Replacing key people is expensive and disruptive. Good strategies for employee retention can stabilize output and preserve institutional knowledge.
Run an efficiency audit every quarter
Use a short recurring review:
- Check trend direction: Is revenue growing faster than total labor burden?
- Compare teams: Which functions are overloaded, and which are underused?
- Look for hidden labor: Agencies, freelancers, and outsourced support often sit outside the headline numbers.
- Decide one move: Automate, reassign, hire, or stop doing something.
The best improvements usually come from clearer systems, not heroic effort.
Tracking Revenue Per Employee with Business Loan Warrior
If you want this metric to help with decisions, you need to track it consistently, not calculate it once during a stressful quarter.
A practical workflow starts with connecting the accounts you already use for operations. Sync bank activity, payroll data, and core revenue inputs in one place. Then calculate standard revenue per employee monthly or quarterly, and track RPE+ alongside it if contractors play a material role in delivery or support.
A simple tracking routine
Use a repeatable sequence:
- Pull revenue for the same period each time. Consistency matters more than frequency.
- Confirm employee count and contractor FTEs. Don’t mix month-end headcount with annual revenue without noting the mismatch.
- Review the trend line, not just one month. Sudden changes usually need context.
- Pair the metric with funding readiness. If you’re planning expansion, staffing efficiency should sit next to cash flow and credit visibility.
It also helps to connect this metric to the commercial engine. Teams working on improve sales productivity often find that cleaner prospecting, handoff discipline, and better follow-up improve revenue output without forcing immediate headcount growth.
What to watch for
If your reported number looks strong but cash feels tight, investigate contractor load, margin pressure, and delayed collections. If your number drops after a hiring phase, that isn’t automatically bad. It may reflect investment ahead of growth.
A dashboard is useful when it helps you spot those stories early and prepare before you enter a financing conversation.
Conclusion and Next Steps
Revenue per employee is one of the simplest efficiency metrics in business, but simple doesn’t mean complete. Used well, it helps you judge whether staffing and revenue are moving in sync. Used carelessly, it can hide the true labor footprint of the business.
The biggest blind spot for many small companies is contractors. Standard calculations usually ignore them, which can make the business look more efficient than it is. That’s why RPE+ matters. It gives you a clearer view of operational efficiency when payroll isn’t the whole workforce.
What to do next
Keep it practical:
- Calculate standard revenue per employee
- Calculate RPE+ if contractors matter
- Compare against relevant industry context, not random averages
- Interpret the number with balance, not ego
- Track the trend over time before making staffing or funding decisions
A useful metric doesn’t just tell you where you are. It helps you make the next decision with less guesswork.
If you run a company in growth mode, this is worth putting on your monthly dashboard. One clean metric won’t run the business for you, but it can stop you from making expensive assumptions.
If you want a clearer view of staffing efficiency before applying for capital, Business Loan Warrior gives you a practical starting point. You can check pre-approval without affecting credit, connect financial accounts securely, and use the platform to organize the revenue, payroll, and funding signals that shape smarter growth decisions.