
A good inventory turnover ratio is generally 5 to 10 turns per year for most small businesses, and that usually means inventory is selling through about every 1 to 2 months. That range is a starting point, though, because the right number shifts with your industry, your product mix, and how fast you can replenish stock.
You might be looking at a shelf that’s fuller than you’d like, or a bank statement that doesn’t leave much room for mistakes. In that moment, inventory turnover stops being an abstract finance ratio and turns into a real question about cash, borrowing power, and whether your stock is helping the business or tying up money you need elsewhere.
Table of Contents
- The Number Lenders Quietly Look At Before Saying Yes
- What Inventory Turnover Actually Measures
- The Standard Good Range and Why It Is Not One Number
- Calculating the Ratio With a Real Worked Example
- How Turnover Connects to Cash Flow and Lending Decisions
- When a Higher Turnover Ratio Is Actually Worse
- Practical Strategies to Improve Your Inventory Turnover
- Reading Turnover Alongside the Other KPIs Lenders Care About
The Number Lenders Quietly Look At Before Saying Yes
A restaurant owner can walk into a lender meeting with solid sales, a decent margin, and a clean story about growth, then get stopped by one line in the file, inventory turnover. That’s because underwriters aren’t just asking whether you sell, they’re asking how quickly your cash gets back off the shelf and into the bank account.
For a first-time borrower, that matters more than it sounds. A lender reviewing working capital wants to know whether the business can keep paying bills while it waits on customers, replenishes stock, and absorbs a slow week without running dry.
Practical rule: inventory that moves at a healthy pace looks like working capital that can support debt. Inventory that sits too long looks like cash trapped in boxes, bins, and shelves.
That’s why the ratio belongs in the same conversation as cash flow and borrowing base. If you want a broader view of how lenders think about operating cash, the borrowing-base discussion in this guide on turning cash conversion into a borrowing-base advantage fits the same logic.
The promise here is simple. By the time you finish reading, you should know what a good inventory turnover ratio looks like, how to calculate it, where your business sits against common benchmarks, and how to tighten the number before your next financing conversation.
What Inventory Turnover Actually Measures
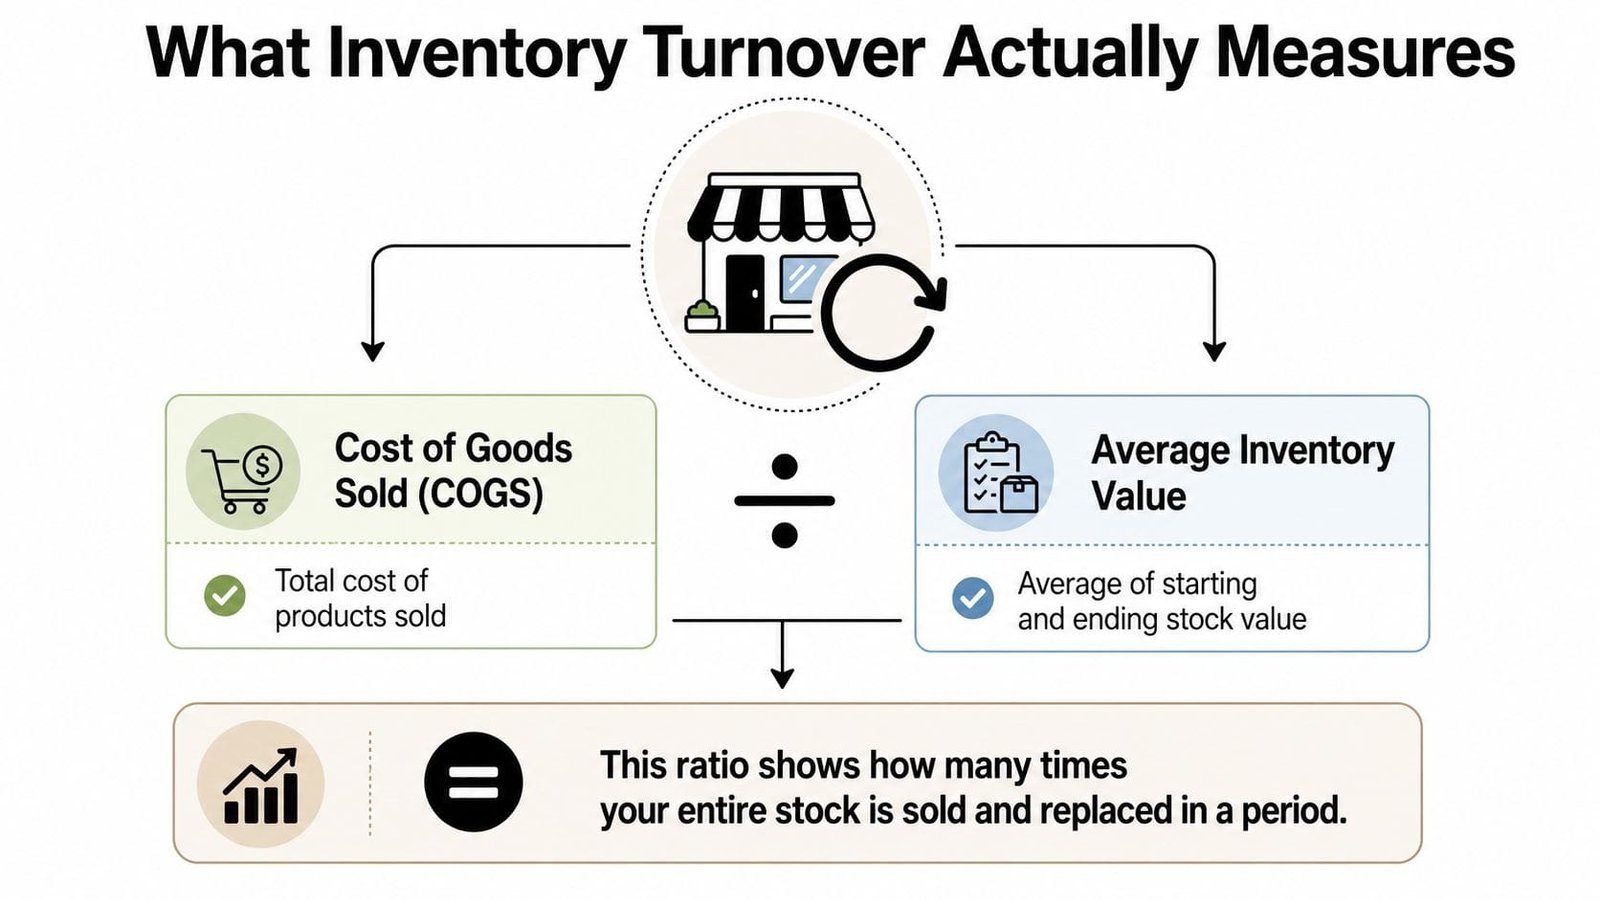
Inventory turnover shows how many times your business sells through and replaces its average stock over a period. In plain English, it tells you how quickly products move off your shelves, become sales, and then get replenished.
The formula and why it uses COGS
The standard formula is COGS divided by average inventory. COGS, or cost of goods sold, captures the direct cost of the products you sold, while average inventory smooths out swings between the start and end of the period. Finance teams prefer this version over a simple ending-inventory snapshot, because a single point in time can make a business look unusually lean or unusually bloated depending on when the count happens.
Pallets moving through a dock illustrate the idea well. If pallets keep leaving and new ones keep arriving at a steady pace, the dock stays active without becoming crowded. If pallets pile up, stock is sitting too long. If the dock empties too fast, you risk running out before the next truck arrives.
Simple test: turnover is a velocity metric, and it is not a profit metric. It shows stock movement speed, while margin captures how much each item earns.
That distinction trips people up. A business can have fast turnover and weak pricing, or slower turnover and strong margins. The ratio tells you about movement, which is why lenders and operators use it as a signal of efficiency rather than a complete verdict on performance.
For a practical walkthrough of inventory controls and management discipline, this inventory management guide pairs well with the metric itself.
The Standard Good Range and Why It Is Not One Number
A widely cited benchmark says a good inventory turnover ratio is usually 4 to 10 turns per year, and many businesses aim for roughly 5 to 10 turns. At that pace, inventory is usually sold and replenished about every 1 to 2 months (Investopedia, Extensiv). That’s a useful starting point, but it’s not a universal pass or fail.
The reason is simple, industries don’t move at the same speed. Neutral industry references place retail and consumer goods around 6 to 10 turns, manufacturing around 3 to 5, and luxury goods around 1 to 3 because each category has different demand patterns, product values, and replenishment cycles. A custom manufacturer carrying long-cycle parts is not supposed to look like a fast-fashion store, and that’s fine.
Inventory turnover benchmarks by industry
| Industry Category | Typical Good Range (Turns/Year) | Approx. Days of Inventory |
|---|---|---|
| Retail and consumer goods | 6 to 10 | About 36 to 61 days |
| Manufacturing | 3 to 5 | About 73 to 122 days |
| Luxury goods | 1 to 3 | About 122 to 365 days |
Those ranges are directionally useful, but they don’t settle the question on their own. A ratio that looks low on paper may be exactly right if your replenishment cycle is long, your items are high value, or stockout risk is expensive. A ratio that looks high can also be a warning if it comes from running too lean and missing sales.
The cleanest way to think about what is a good inventory turnover ratio is this, good means fast enough to avoid excess carrying costs, but not so fast that you’re starving the business of stock. That balance changes with the product, the channel, and the service level you need to protect.
Calculating the Ratio With a Real Worked Example
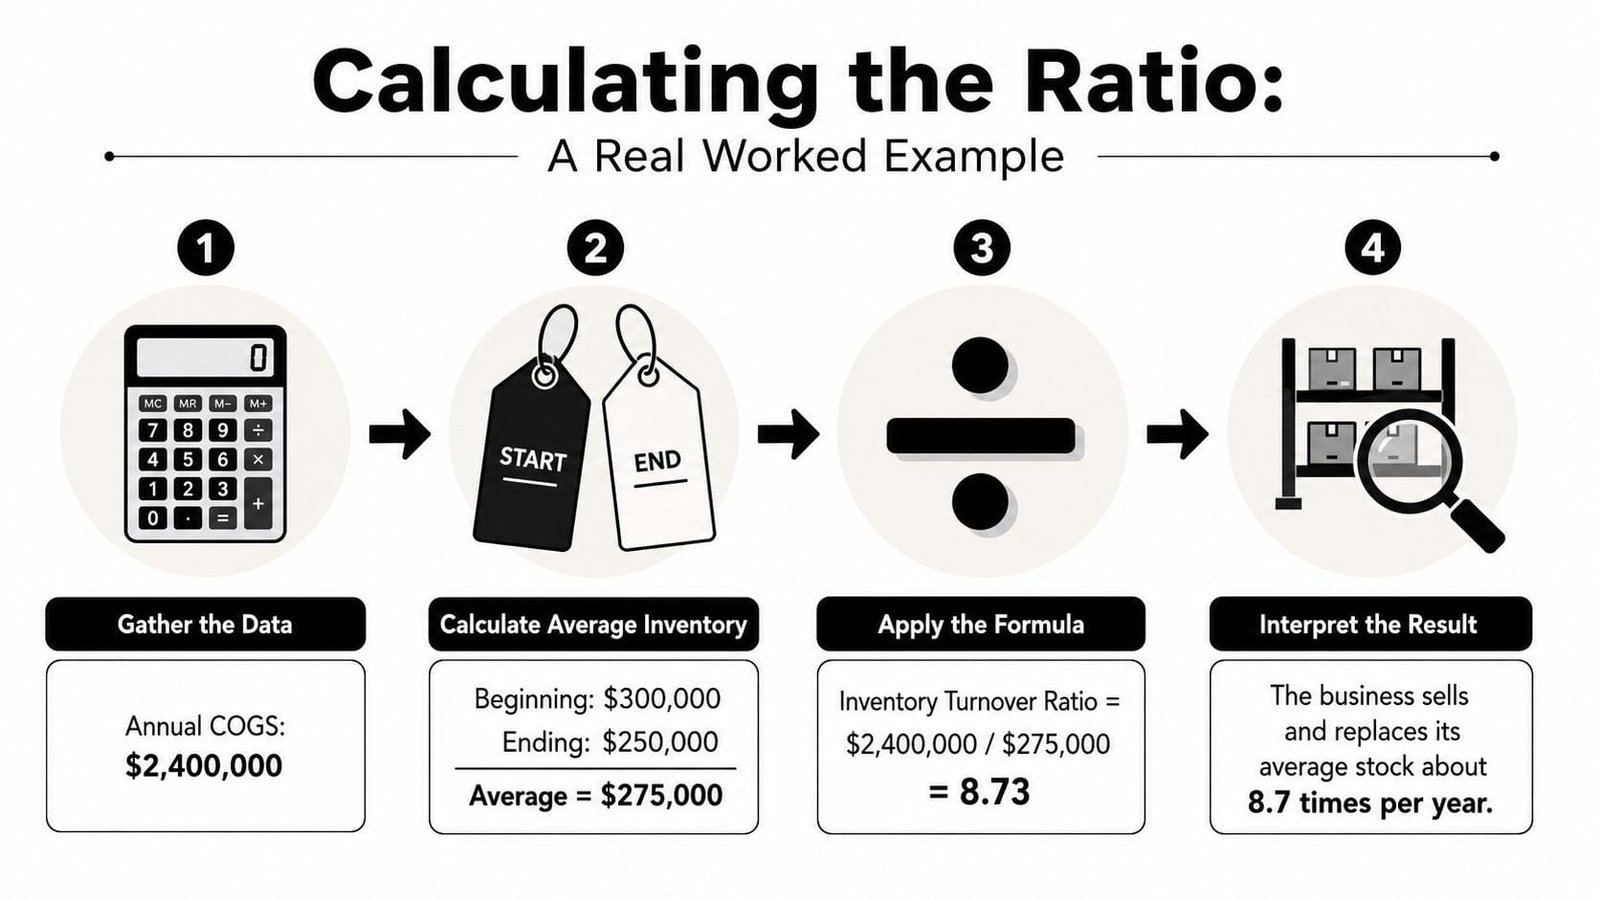
A specialty retailer sells $2.4M in goods at cost over a year. It starts the period with $300,000 in inventory and ends with $200,000, so average inventory is $250,000. Divide COGS by average inventory, and the turnover ratio is 9.6 turns per year.
That result sits comfortably inside the commonly cited good range. It also translates into roughly 38 days of inventory on hand if you use 365 divided by the ratio, which gives a much more intuitive feel for how long stock sits before it turns back into cash.
What changes when the number moves
If the same retailer runs a promotion and pushes turns up to 12, that might sound impressive, but the question is whether shelves stayed full enough to meet demand. If the ratio falls to 5, the business may be carrying more stock than it needs, and that can squeeze cash.
A useful resource for category-specific calculation thinking is this inventory turnover rate calculation guide for Amazon sellers. The channel matters because a marketplace seller, a local retailer, and a warehouse distributor don’t all use the same operating rhythm.
The point of the math is not to chase a flashy number. It’s to understand which levers move the ratio, how fast stock is converting, and whether the result supports growth without creating avoidable strain.
How Turnover Connects to Cash Flow and Lending Decisions
Inventory turnover matters to lenders because it translates stock into cash language. Faster-moving inventory usually means money comes back sooner, which helps with payroll, supplier bills, rent, and debt service. Slower-moving inventory does the opposite, it ties up working capital in stock that hasn’t yet earned its way back into the bank.
That’s why underwriters care about the ratio when a business applies for working capital, a line of credit, or SBA-style financing. They’re looking for signs that the company can operate without constantly stretching its cash cycle, and turnover is one of the clearest clues.
A lender may not say it out loud, but the question is often simple, how long does your money sit on the shelf before it becomes cash again?
If you want to see the cash side of that story from another angle, this cash-flow resource for CFOs is helpful because it shows how inventory speed and collection speed affect the same liquidity picture. A strong inventory ratio can still be undermined if receivables are slow, because cash only helps if it comes back in.
The lending takeaway is candid. A decent ratio helps your file because it suggests discipline. A weak ratio can raise questions about excess inventory, obsolete stock, or poor planning. A ratio that’s too aggressive can also raise questions, because a lender may wonder whether you’re understocked and one supply hiccup away from lost revenue.
Before a financing conversation, it helps to review your stock decisions alongside the rest of your cash picture and tighten the story with the numbers that matter. If you’re getting your file ready, this cash-flow improvement guide is a practical companion to the inventory discussion.
When a Higher Turnover Ratio Is Actually Worse
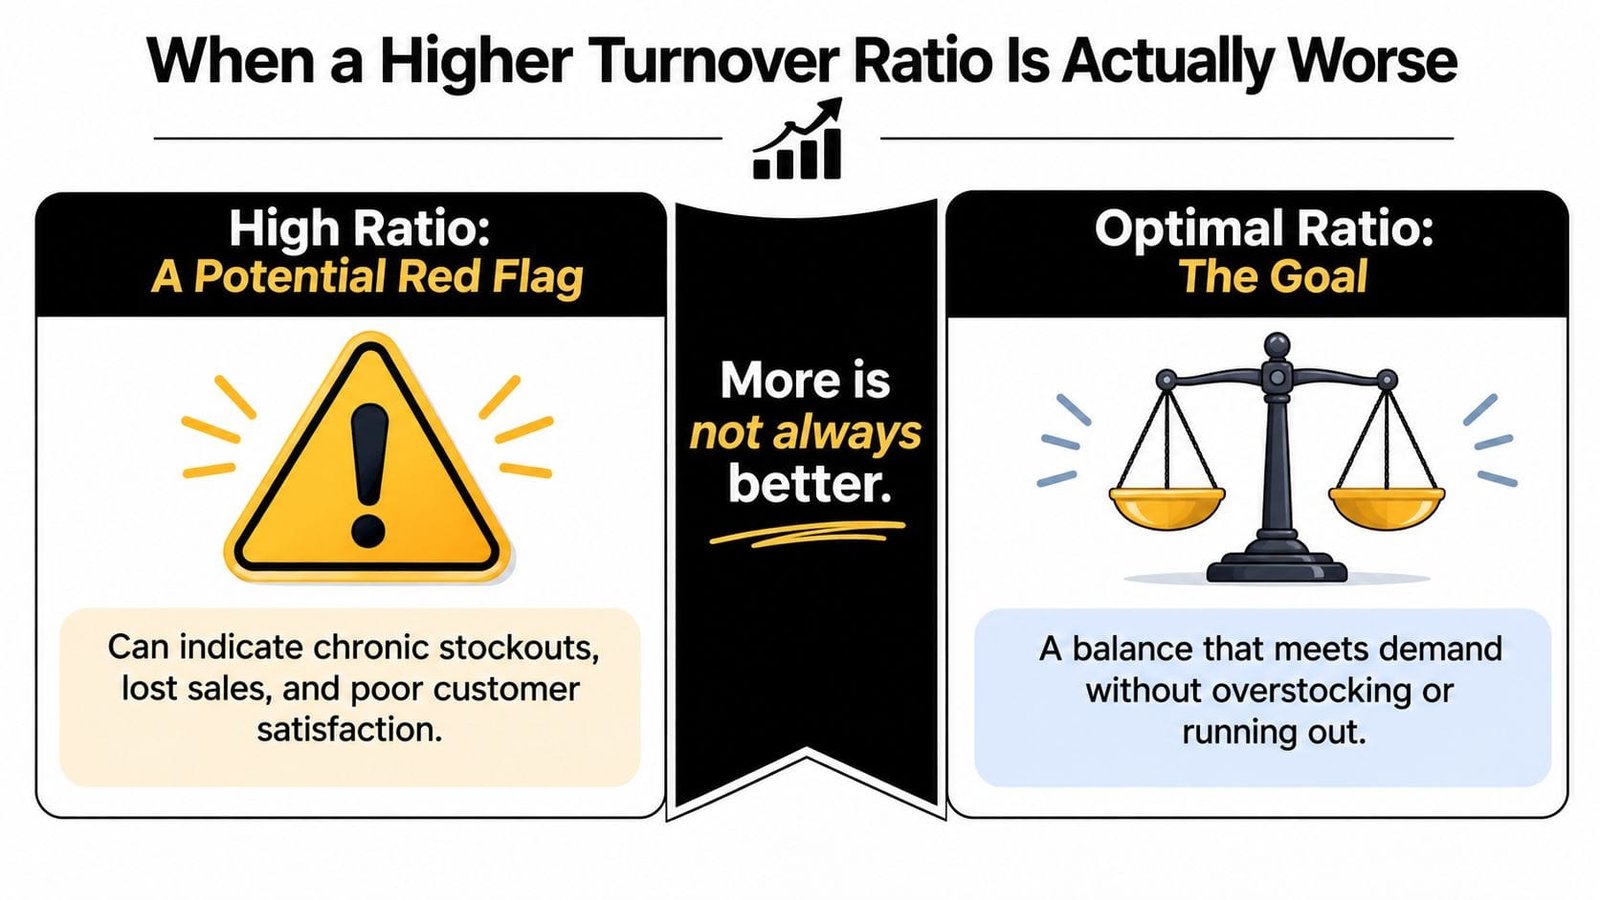
A higher ratio sounds good until it starts causing stockouts. A small e-commerce merchant can cut inventory too hard, see turnover jump from 6 to 14, and still end up worse off because customers can’t find the sizes or styles they want. The ratio looks disciplined, but the business loses sales and disappoints buyers.
That’s the trap. Inventory turnover is not a trophy for running the leanest possible warehouse. It’s a balance between carrying enough product to serve demand and not sitting on so much stock that cash gets trapped.
Why the “more is better” rule breaks down
A too-high ratio can mean you’re running on thin safety stock, which increases the odds of missed sales when demand spikes or supplier timing slips. It can also create a false sense of efficiency if the only reason turnover rose was because management cut inventory faster than demand recovered.
A balanced operator cares about service level as much as velocity. If the shelf is empty when the customer wants to buy, the ratio may look attractive while the business gives revenue away to a competitor with better availability.
That’s why the best answer to what is a good inventory turnover ratio isn’t “the highest one possible.” It’s the number that fits your demand pattern, lead times, and customer expectations without creating avoidable shortages.
More turnover is not always better. The right number is the one that protects sales and still keeps cash moving.
Practical Strategies to Improve Your Inventory Turnover
The fastest gains usually come from better forecasting, cleaner ordering, and tighter SKU discipline. Start with recent sales patterns, not gut feel, because stale buying habits are one of the easiest ways to carry dead stock into the next quarter.
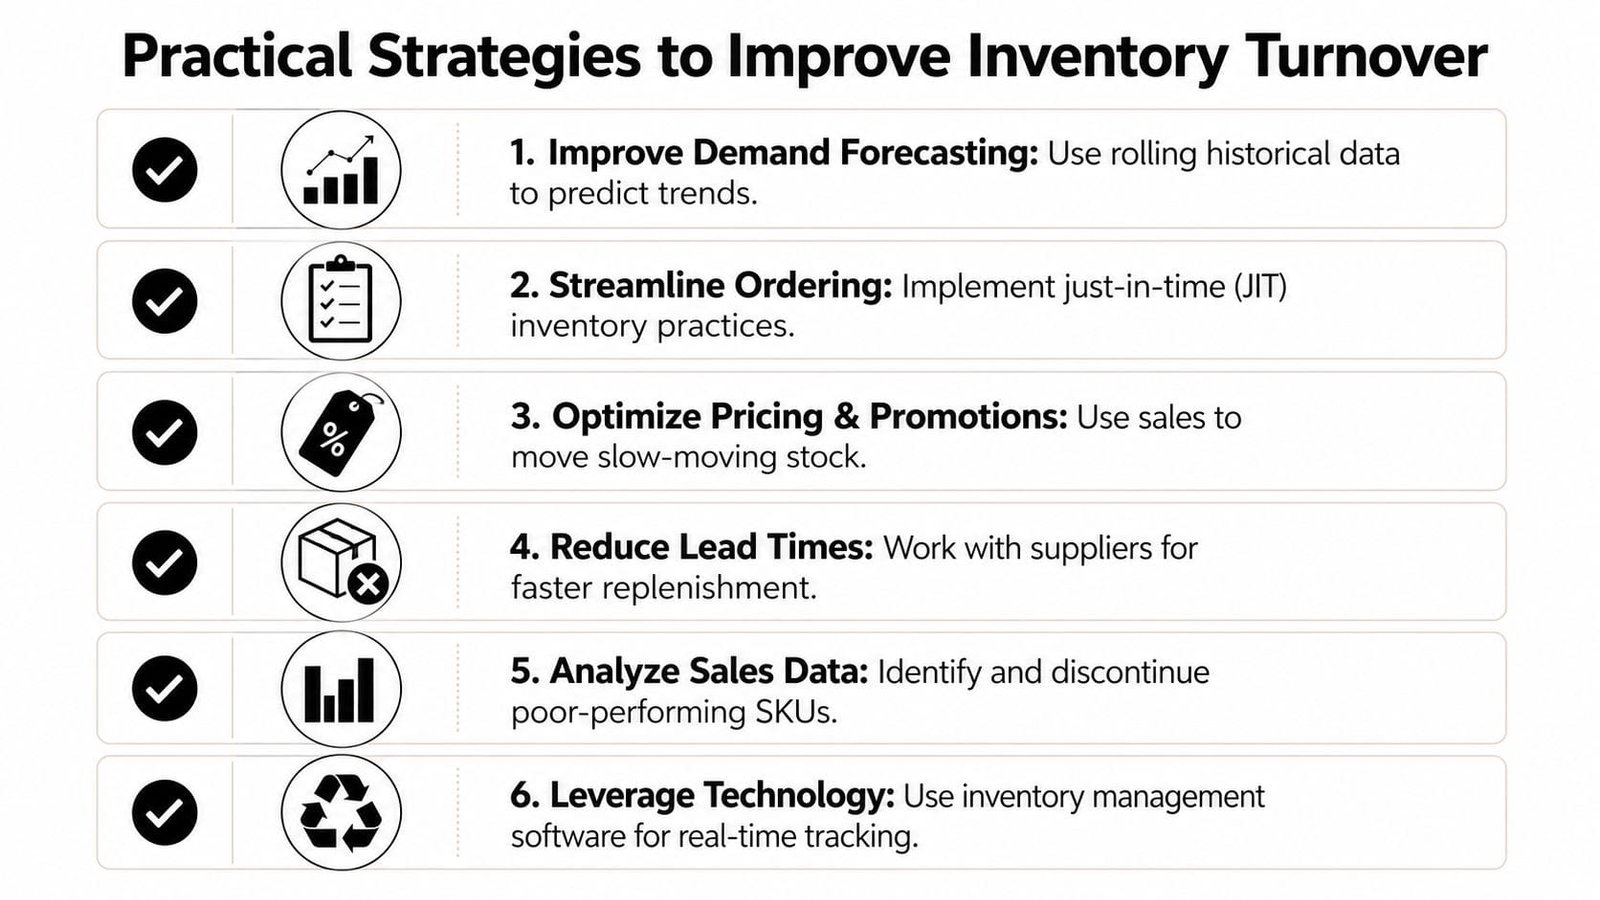
Six levers that usually move the number
- Tighten demand forecasting. Use rolling sales data to spot which SKUs are really moving, then order to match actual velocity instead of last season’s assumptions.
- Review supplier lead times. If vendors can replenish faster, you can carry less buffer stock without risking empty shelves.
- Cut slow movers. Quarterly SKU reviews force you to confront products that look busy on paper but barely contribute to cash.
- Use pricing and promotions with intent. Aging stock often needs a planned markdown rather than another month of shelf space.
- Separate inventory by velocity. ABC-style segmentation keeps management attention on the items that matter most to revenue and cash.
- Use better tools when the process gets messy. Inventory software helps, but only if it gives you reliable visibility into what sells, what stalls, and what needs reordering.
For a broader playbook on these decisions, Next Point Digital’s inventory management best-practices guide is a useful reference. The ideas there align with what strong operators do in practice, they keep the ordering process tied to demand, not habit.
One more option belongs on the table for businesses that need financing while they improve the process. Business Loan Warrior helps small businesses apply for funding through a single no-fee application and can connect owners with options like lines of credit, SBA loan processing, short-term financing, and invoice financing. That matters because better turnover and better financing often need to work together, not separately.
Reading Turnover Alongside the Other KPIs Lenders Care About
A lender rarely looks at turnover in isolation. Gross margin tells them whether sales are happening profitably, days sales outstanding shows how quickly customers pay, and the current ratio gives a quick view of short-term liquidity. Together, those measures tell a much fuller story than turnover alone.
A business with a 7-turn inventory ratio and slow collections looks very different from a business with the same turnover but faster customer payments. In the first case, cash may still be stuck in receivables even if stock is moving. In the second, the business can recycle cash faster and look easier to support with debt.
What to pull together before a lender review
- Inventory turnover so the lender can see how fast stock converts to sales.
- Gross margin so they can tell whether turnover is being bought with deep discounting.
- Days sales outstanding so they can judge how long it takes to collect cash after the sale.
- Current ratio so they can check near-term liquidity.
- A simple explanation of inventory strategy so the file makes sense in real operating terms, not just as ratios on a page.
That mix is what turns a spreadsheet into a credible borrowing story. A lender wants to know the business is moving product, collecting cash, and keeping enough liquidity to handle normal bumps without reaching for emergency funding.
If you’re reviewing your own numbers, start with turnover, then line it up with the rest of the operating picture. That’s the cleanest way to answer the question lenders really ask, not just whether the business sells, but whether it sells in a way that supports repayment.
Business Loan Warrior helps small business owners connect operating metrics like inventory turnover to real funding options. If you’re getting ready for a working capital request, visit Business Loan Warrior to compare financing paths and see how your numbers fit the lending conversation.