
Maria's bakery had a problem that many owners recognize too late. Her quarterly profit and loss statement showed $28,000 in profit, yet her operating line of credit was maxed out and supplier invoices kept accumulating. The statement said “profitable.” Her bank account said “under pressure.”
That contradiction doesn't necessarily mean the P&L is wrong. It may mean the statement is measuring accounting profit while the business is absorbing higher inventory costs, loan interest, delayed collections, owner withdrawals, or other cash demands. A P&L tells you what the business earned and spent during a period, but it doesn't automatically tell you whether that profit is durable or economically sufficient.
This guide shows how to calculate profit and loss step by step, identify the line items owners commonly misclassify, and test whether reported profit survives inflation, margin compression, and financing costs. The objective isn't a good-looking report. It's a statement you can use to make hiring, pricing, borrowing, and spending decisions with confidence.
Table of Contents
- Why a Profit and Loss Statement Matters More Than You Think
- The Building Blocks of a Profit and Loss Statement
- A Worked Example From Revenue to Net Income
- Margin Benchmarks That Tell You If Your P&L Is Healthy
- Turning Your P&L Into a Forecasting and Decision Tool
- Key Takeaways, Common Errors, and Quick Answers
Why a Profit and Loss Statement Matters More Than You Think
A profit and loss statement, also called an income statement, measures revenue, expenses, and profit or loss over a defined period. That period might be a month, quarter, or year. Unlike a bank statement, which shows cash movement, the P&L shows whether the operating model generated more income than the costs assigned to that period.
Maria's bakery illustrates why the distinction matters. If flour, packaging, and other inventory inputs became more expensive, her recorded sales could rise while her gross margin weakened. If interest on the line of credit was buried in a broad “other expenses” category, the operating result might look stronger than the amount available after financing costs. If Maria withdrew money from the business, that withdrawal could reduce cash without appearing as an operating expense.
The result is a familiar trap: profit on paper, pressure in practice.
Practical rule: Never judge a P&L from the bottom line alone. Read gross profit, operating income, interest, and the bank balance together.
What the P&L answers
A properly prepared statement helps answer four operating questions:
- Is the core offer profitable? Gross profit shows what remains after direct costs.
- Is the overhead affordable? Operating income shows whether recurring operating expenses fit within gross profit.
- Is financing consuming the result? Interest and other non-operating items reveal costs that sit outside ordinary operations.
- Is the reported result repeatable? One-time gains, unusual repairs, temporary discounts, and owner-related transactions can distort the period.
That's why lenders, investors, and landlords commonly request a P&L when they assess a business. They're not only looking for a positive number. They're examining the quality of revenue, the structure of costs, and the consistency of earnings.
The underlying idea has a long accounting history. Double-entry bookkeeping appeared in surviving Florentine merchant records in the 1290s, and Luca Pacioli systematized the method in a 1494 treatise, a milestone widely treated as the first written explanation of the approach (ICAEW historical timeline). The core calculation remains straightforward, revenue minus expenses, but classification determines whether that calculation explains reality.
For a practical companion on organizing and managing the statement, see this guide to managing a P&L. The important point is simple: Maria doesn't need a more attractive report. She needs a report that separates operating performance from cash strain and shows which pressure is temporary versus structural.
The Building Blocks of a Profit and Loss Statement
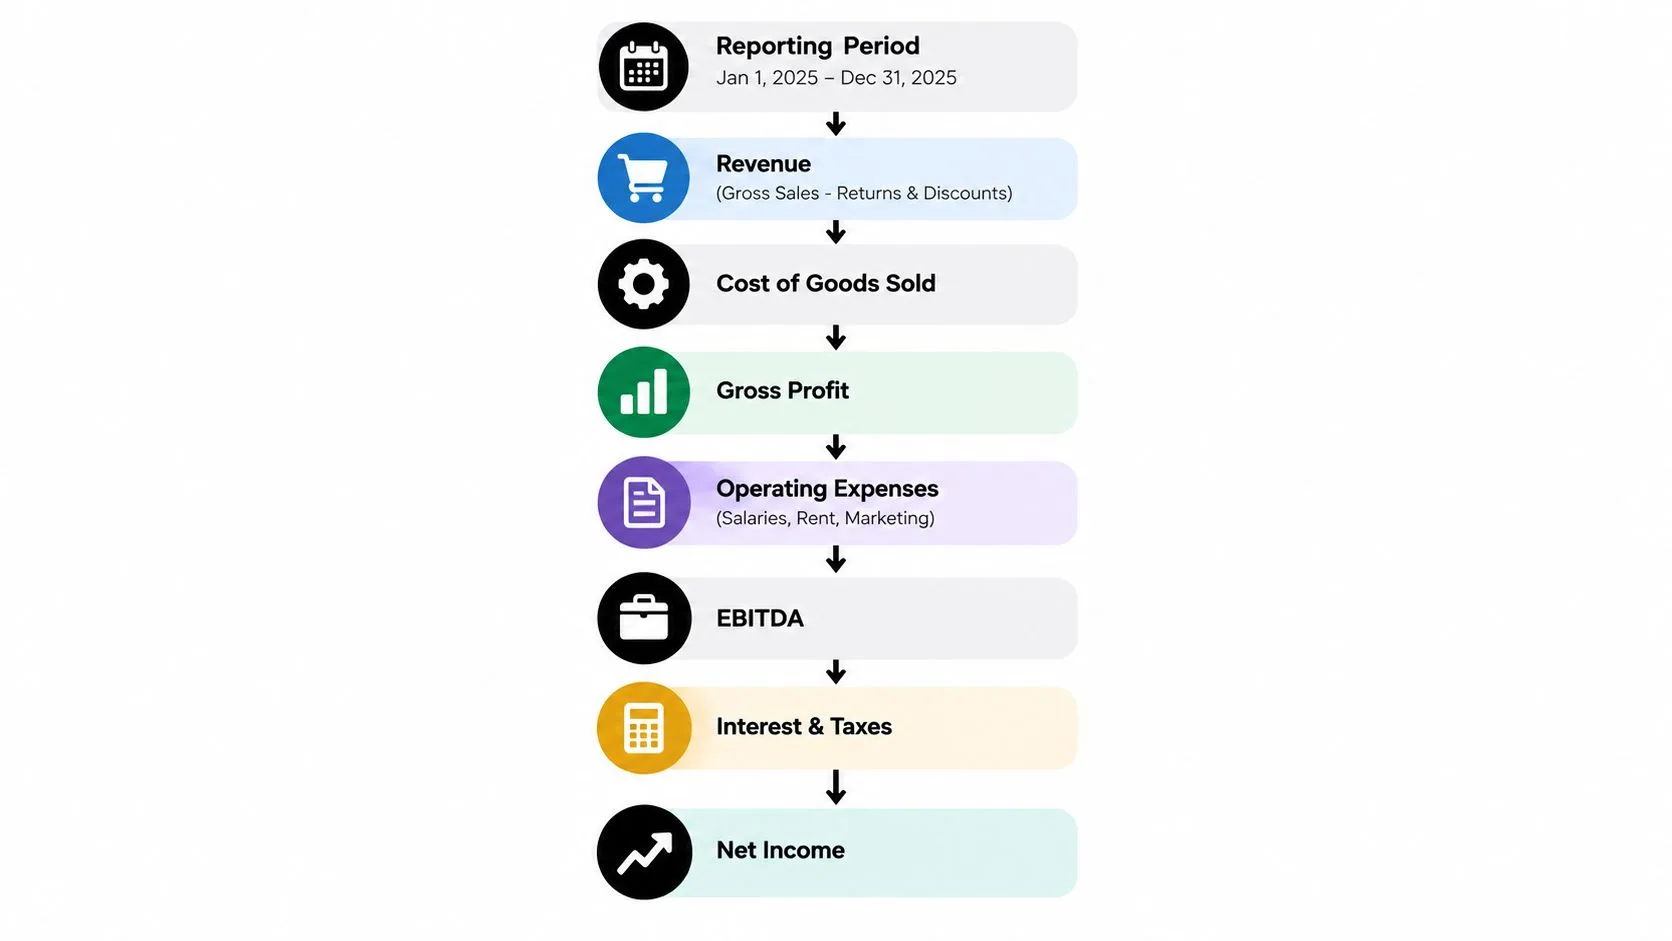
Start with the period. Choose the exact dates you're analyzing, then collect sales records, refunds, purchasing records, payroll, bills, card activity, interest, taxes, and relevant adjustments. A P&L without a consistent period is difficult to compare and easy to misread.
Build the statement from the top down
Revenue is the money earned from selling products or services. Begin with gross sales, then subtract returns, allowances, and discounts to arrive at net revenue. Returns and discounts should be visible enough to explain why gross sales and the amount retained by the business differ.
Cost of goods sold, or COGS, captures direct costs required to deliver what was sold. For an inventory business, a useful formula is:
COGS = Opening inventory + Purchases − Closing inventory
For a service business, direct subcontractor labor, delivery costs, project-specific software, and production materials may belong in COGS. The test is whether the cost moves directly with fulfilling the sale, not whether it feels important.
Subtract COGS from net revenue:
Gross profit = Net revenue − COGS
Gross margin then expresses that result relative to revenue:
Gross margin = Gross profit ÷ Net revenue
This is the first major diagnostic. A weak gross margin points toward pricing, purchasing, waste, labor efficiency, or service mix. It isn't primarily an advertising or rent problem.
Classify operating costs carefully
Operating expenses are the costs of running the business after direct delivery costs. Group them into useful categories such as:
- Selling expenses: Sales commissions, advertising, promotions, and customer acquisition.
- General expenses: Office costs, professional fees, insurance, and administrative payroll.
- Administrative expenses: Rent, utilities, management salaries, and recurring systems.
Subtract operating expenses from gross profit:
Operating income = Gross profit − Operating expenses
Owners often need help separating fixed versus variable costs for cleaners, particularly when labor, travel, supplies, and administrative overhead behave differently as bookings change. That distinction can also improve budgeting for other service businesses (fixed vs variable costs for cleaners).
Next, record non-operating items such as interest income, interest expense, gains, or losses from unusual transactions. Subtract interest, taxes, depreciation, and amortization as appropriate to reach net income. The precise presentation can vary, but the economic question stays consistent: what remains after the costs required to operate, finance, and report the business have been recognized?
Two placement decisions deserve special attention. If the owner works in the business, decide whether a market-based owner salary belongs in operating expenses, and apply that policy consistently. Owner draws aren't operating expenses, but excluding a realistic replacement salary can make a labor-intensive business appear healthier than it is. Returns and discounts should reduce revenue, not disappear inside miscellaneous expenses, because they reveal pricing and sales-quality problems.
A Worked Example From Revenue to Net Income
Consider a freelance designer who earned substantial project revenue during the period but also used subcontractors and specialized tools to deliver the work. The cleanest way to calculate profit and loss is to move line by line, keeping direct project costs separate from overhead.
The designer recorded $240,000 in gross revenue. Returns and discounts totaled $8,000, so net revenue was $232,000. Direct costs, including software used for delivery, subcontractors, and stock assets, came to $72,000. That produces gross profit of $160,000.
Operating expenses totaled $96,000. The category included marketing, rent, software subscriptions, and a $48,000 owner salary. After those costs, operating income was $64,000. Interest expense of $3,200 reduced the result to $60,800 in net income, before considering any applicable tax presentation.
| Line Item | Amount | Formula / Note |
|---|---|---|
| Gross revenue | $240,000 | Total project billings |
| Returns and discounts | ($8,000) | Reductions from gross revenue |
| Net revenue | $232,000 | $240,000 − $8,000 |
| COGS | ($72,000) | Direct delivery costs |
| Gross profit | $160,000 | $232,000 − $72,000 |
| Operating expenses | ($96,000) | Marketing, rent, subscriptions, owner salary |
| Operating income | $64,000 | $160,000 − $96,000 |
| Interest expense | ($3,200) | Financing cost |
| Net income | $60,800 | $64,000 − $3,200 |
What the margins reveal
Gross margin is calculated as gross profit divided by net revenue. In this example, $160,000 ÷ $232,000 produces a gross margin of about 69 percent. Net margin is net income divided by net revenue, so $60,800 ÷ $232,000 produces a net margin of about 26 percent.
Those two figures answer different questions. The gross margin says the designer retains a substantial amount after direct project costs. The net margin shows what remains after overhead and interest. If the designer's gross margin fell while revenue stayed steady, the first investigation should focus on subcontractor rates, software allocation, scope creep, and pricing. If gross margin held but net margin declined, overhead or financing deserves attention.
A calculator can reduce arithmetic errors, especially when testing several pricing or cost scenarios. For owners who want a dedicated strumento per calcolare il profitto, ELECTE provides a focused way to work through the calculation. The tool doesn't replace classification judgment, though. Garbage in still produces a polished but unreliable result.
The example also makes cost control concrete. A $20,000 reduction in COGS would increase net income by roughly that amount if revenue and other expenses stayed unchanged. A $15,000 reduction in operating expenses would have a similar direct effect. Neither action is automatically wise. Cutting subcontractor support could damage delivery capacity, while cutting marketing could weaken future demand. The P&L identifies the financial effect, but management still has to assess the operational trade-off.
For the final profitability calculation and related terminology, this explanation of how to find net income provides a useful reference.
Margin Benchmarks That Tell You If Your P&L Is Healthy
A margin is more useful than a raw profit figure because it connects profit to the revenue required to produce it. Start with three formulas:
- Gross margin = (Revenue − COGS) ÷ Revenue. Use it to assess pricing and direct delivery economics.
- Operating margin = Operating income ÷ Revenue. Use it to assess whether recurring overhead fits the gross profit generated.
- Net margin = Net income ÷ Revenue. Use it to assess what remains after operating costs, interest, taxes, depreciation, and amortization.
A strong net margin can hide a weakening gross margin. Suppose prices remain unchanged while materials, wages, or subcontractor rates increase. Overhead may still be controlled well enough to produce a positive net result, but the business has less room to absorb another cost increase. That's margin compression, and it often appears first above the operating line.
For broad small-business context, 10 to 20 percent is commonly cited as a healthy net profit margin, while 5 to 10 percent is more typical in competitive or low-margin sectors (Xero profitability guidance). The same source notes that gross margins often benchmark around 50 to 70 percent for service businesses and 20 to 50 percent for retail or product businesses. These are reference ranges, not targets that override your business model, geography, pricing position, or growth stage.
Use the comparison without forcing a false answer
The requested industry comparison is best treated as a diagnostic map. Industry-specific operating and net margins can vary too widely to assign a universal range without reliable, comparable data. Use your own historical trend first, then compare against credible peers using consistent accounting treatment.
| Industry | Gross Margin | Operating Margin | Net Margin | Watch Out When |
|---|---|---|---|---|
| Retail | Often lower than service businesses because product costs are substantial | Depends heavily on turnover and store overhead | Commonly pressured by rent, labor, and financing | Gross margin falls while prices stay flat |
| SaaS | Often driven by hosting, support, and implementation allocation | Sensitive to sales and marketing investment | Can remain weak while the company funds growth | Sales and marketing rises faster than recurring revenue |
| Restaurants | Direct food and labor costs strongly influence gross profit | Rent, staffing, utilities, and delivery fees matter | Small operating changes can affect the bottom line quickly | Food cost and labor cost rise together |
| Professional services | Usually benefits from limited physical inventory | Utilization, subcontractors, and payroll drive operating performance | Owner compensation and business development can distort comparisons | Billable rates lag wage and contractor increases |
Three signals deserve immediate attention. A declining gross margin with flat pricing usually demands a pricing or COGS review. Sales and marketing as a rising share of revenue may indicate inefficient acquisition or an intentional investment that hasn't matured. Interest expense approaching or exceeding operating income means the operating model is producing little benefit for the owner after financing.
For a deeper explanation of the operating measure, review this guide to operating profit margin. The practical lesson is to read gross and net margins together. Gross margin tells you whether the sale works. Net margin tells you whether the company, as currently structured, works.
Turning Your P&L Into a Forecasting and Decision Tool
A historical P&L is useful, but it's incomplete if you only read it after the month has ended. Treat it as the starting point for a rolling twelve-month forecast. Each month, replace the oldest period with the latest result, then compare the forecast with what happened.
Use the prior P&L as a baseline, but document every assumption. Build a base scenario using expected revenue, current pricing, known contracts, planned headcount, and realistic COGS. Create a downside scenario that reflects weaker demand, delayed collections, higher direct costs, or an unavoidable staffing expense. Create an upside scenario only when you can explain the additional volume and the cost required to serve it.
Track the trend, not just the total
Plot monthly revenue, gross profit, and net income for the trailing twelve months. A sudden gross-margin contraction without a pricing change should trigger a review of purchasing, labor allocation, inventory adjustments, and product mix. The two-point margin-contraction alert is a practical internal threshold for that review, not a universal accounting rule.
Inflation complicates the interpretation. A business can report nominal profit while earning less in economic terms if selling prices rise more slowly than input costs. The 2026 industry summary cited in the provided research reports 75.6 percent of small-business owners reporting higher costs, with profitability 41 to 46 points below pre-pandemic levels (2026 small-business margin analysis). An IIMA survey reported that firms saying margins were “somewhat less than normal” or worse fell to 70 percent in July 2026 from 78 percent in May 2026, suggesting modest improvement while margin stress remained widespread. Those dated figures should be read as context, not as a substitute for your own ledger.
A simple real-profit check is to compare nominal net-income growth with the percentage change in CPI. Subtracting CPI change from nominal net-income growth gives an approximate view of real economic gain. It's not a complete inflation accounting model, but it can stop an owner from celebrating revenue growth that merely reflects higher prices.
Use the forecast to make operating calls
- Hire when capacity and contribution are visible. Add payroll when the forecast shows enough recurring gross profit to support the role under the downside scenario, not only under the upside case.
- Raise prices when gross margin erodes. First quantify the direct-cost increase, then test customer sensitivity and contract terms. A price increase that protects margin may be healthier than chasing unprofitable volume.
- Use credit deliberately. A line of credit can make sense when it protects supplier terms or bridges a timing gap between delivery and collection. It's dangerous when it funds recurring operating losses that the P&L keeps revealing.
For ecommerce operators, an analytics framework such as this Arlo Inc. analytics guide can help connect transaction trends with financial review. The tool matters less than the discipline: every forecast assumption should have an owner, a rationale, and a later actual result to compare.
Key Takeaways, Common Errors, and Quick Answers
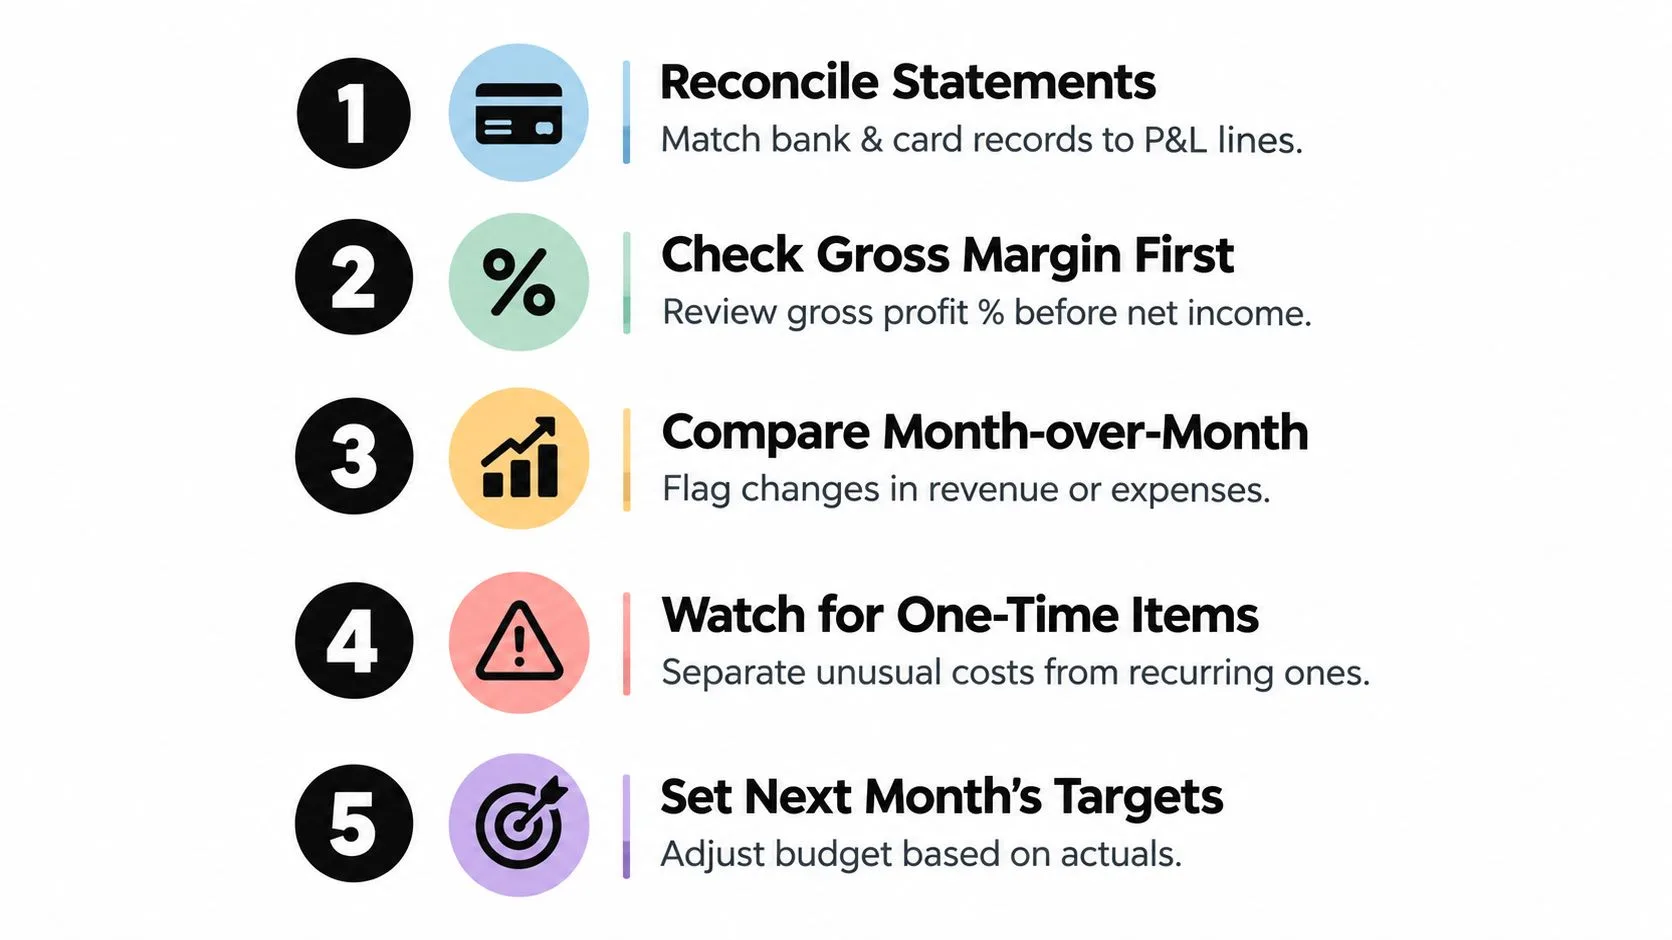
Close the P&L every month with five actions. First, reconcile bank and card statements to the lines in the report. Second, inspect gross margin before looking at net income. Third, compare the current period with the trailing three periods. Fourth, refresh the rolling forecast. Fifth, read the P&L against the bank balance and investigate any large mismatch.
Troubleshoot the lines owners get wrong
- Owner draws counted as profit: A draw takes cash out but isn't revenue or an operating expense. Keep it separate from business performance.
- Loan principal lumped with expenses: Principal reduces the debt balance. Interest is the financing expense. Combining them makes profitability and debt movement harder to interpret.
- Inventory shrinkage ignored: Missing, damaged, or spoiled inventory can overstate closing inventory and understate COGS.
- Accrued revenue never reversed: If revenue was recognized before collection or fulfillment, review the entry so the next period doesn't count it again.
- Refunds netted invisibly against sales: Record returns and discounts clearly so pricing and sales quality remain visible.
- Personal expenses run through the business: Reclassify them promptly. They distort operating costs and can weaken confidence in the statement.
- Depreciation skipped to inflate earnings: Assets lose economic value over time. Ignoring depreciation can overstate the period's result.
Quick answers to four common questions
How often should I update the P&L? Monthly is the most useful operating rhythm for many small businesses. Quarterly review can supplement it, but waiting until year-end makes corrective action slower.
Cash or accrual accounting? Cash basis is simpler and shows when money moves. Accrual basis records revenue and expenses when the underlying transaction occurs, which can provide a clearer view when invoicing, inventory, payables, or receivables create timing differences. Pick a method that fits the business and apply it consistently with professional accounting guidance.
Why is profit positive while cash is negative? Receivables may not have been collected, inventory may have absorbed cash, debt principal may have been repaid, or owner draws and capital purchases may have reduced the bank balance without reducing accounting profit in the same way. Reconcile the P&L to the cash flow and balance sheet instead of changing the profit figure to match the bank.
What does a banker need before taking the P&L seriously? Provide a clearly labeled reporting period, consistent accounting basis, reconciled statements, separate owner transactions, visible interest expense, sensible COGS classification, and explanations for unusual movements. A banker can work with a modest profit more easily than with a report whose categories change every month.
The most reliable way to calculate profit and loss is to make the statement explain the business, not merely total it. Review your latest P&L line by line, test the gross margin against current input costs, and update the forecast before making your next major spending or borrowing decision.
Business Loan Warrior helps small businesses evaluate working capital, lines of credit, SBA financing, equipment loans, and other funding options against the numbers in their P&L. Visit Business Loan Warrior to explore financing options and connect your reported profitability with a practical plan for cash flow and growth.